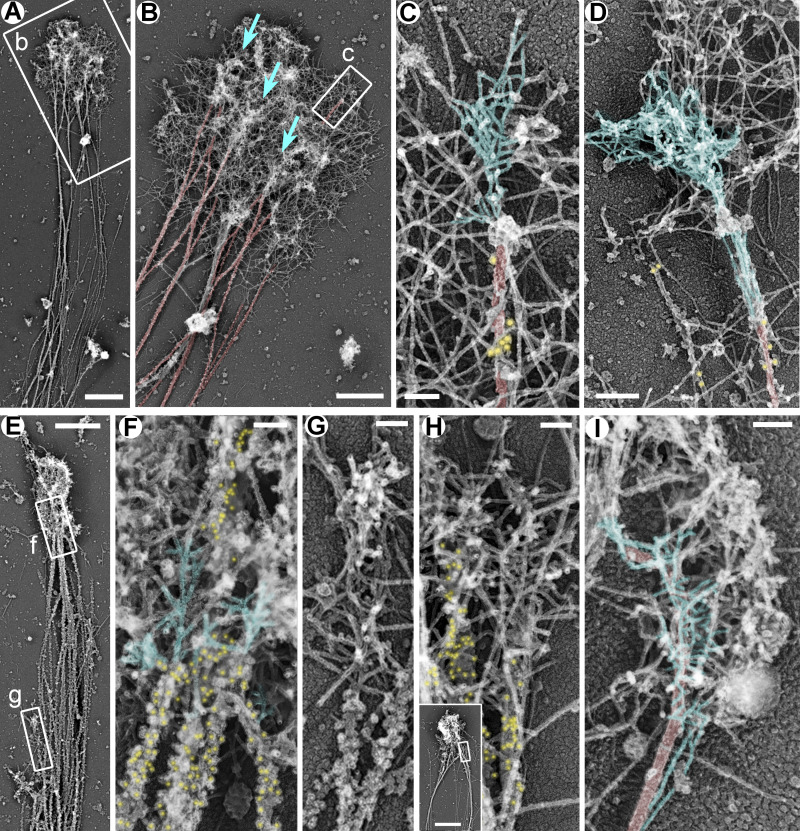
Figure 2.
Branched actin networks in growth cones of rat hippocampal neurons treated with low concentrations of actin polymerization inhibitors. (A–D) DIV2 neurons treated for the last 24 h with 5 µM LatB and stained with DM1α antibody against α-tubulin and secondary antibody conjugated to 18-nm colloidal gold. Boxed regions in A and B are enlarged in B and C, respectively. Blue arrows in B indicate accumulations of branched actin networks that appear to emerge from microtubules. (E–H) DIV3 rat hippocampal neurons treated for the last 24 h with 1 µM CytoD and stained with DM1α antibody and 12-nm colloidal gold-conjugated secondary antibody. Boxed regions in E are enlarged in F and G. Inset in H shows an overview of the growth cone; the boxed region corresponds to the main panel. (I) DIV2 rat hippocampal neuron treated for the last 24 h with 1 µM CytoD without immunogold labeling. Color coding: blue, branched actin filaments that appear to emerge from microtubules; red, microtubules; yellow, immunogold. Scale bars, 2 µm (A and inset in H), 1 µm (B and E), 100 nm (C and F–I), and 200 nm (D).

