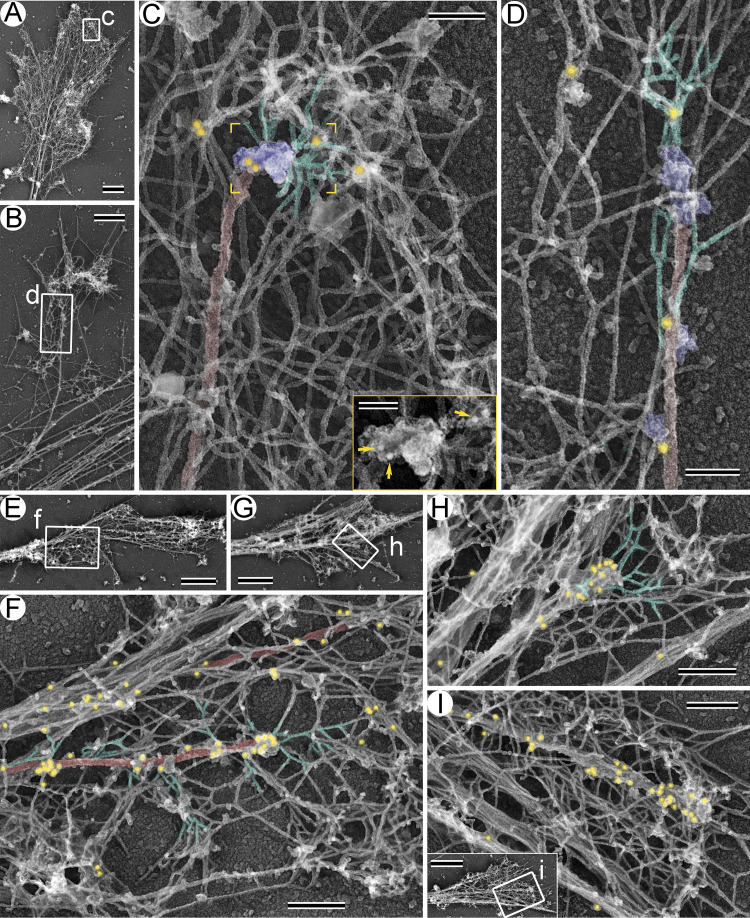
Figure 4.
Immunogold labeling of APC in neuronal growth cones. (A–D) DIV3 neurons. (E–I) DIV14 neurons. A, B, E, and G and the inset in I show growth cone overviews. Boxed regions in these panels are enlarged in C, D, F, H, and I, respectively. Color coding: branched actin filaments (green), microtubules (red), putative +TIPs (purple), and 18-nm APC immunogold (yellow). Inset in C shows the yellow-framed region from the main panel without pseudocolor; yellow arrows mark APC immunogold. Scale bars, 1 µm (A, E, G, and inset in I), 500 nm (B), 200 nm (F, H, and I), 100 nm (C and D), and 50 nm (inset in C).

