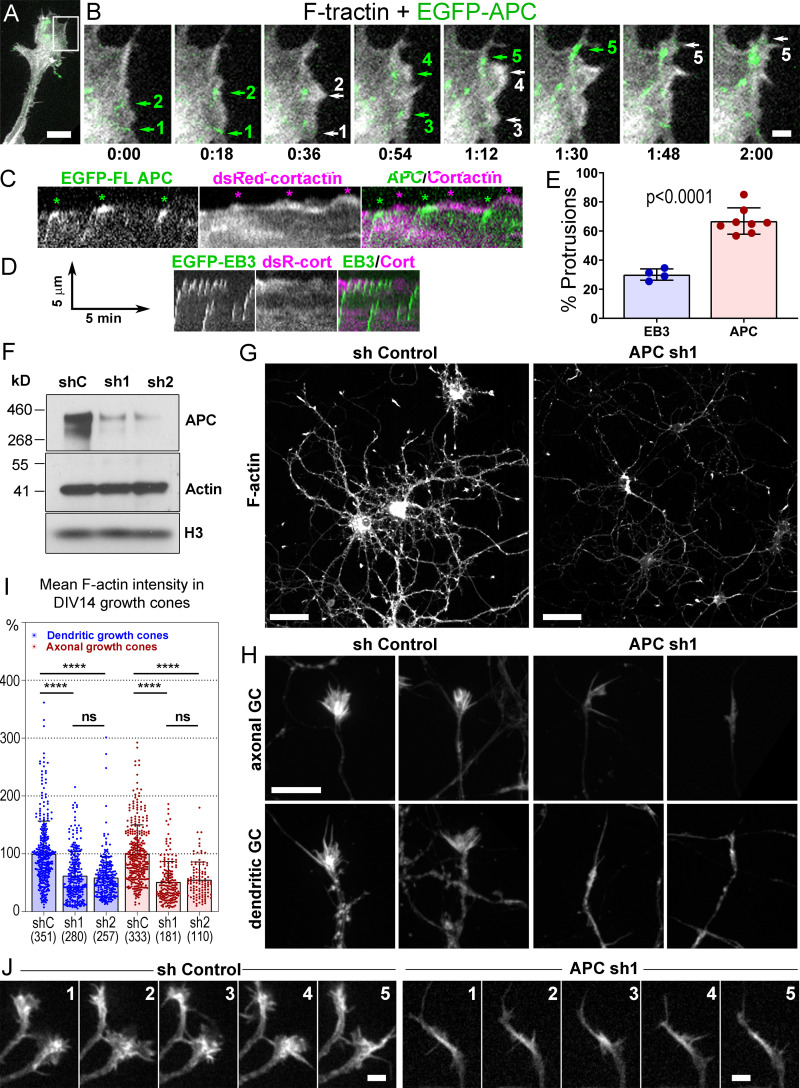
Figure 5.
Roles of APC in actin-based protrusions. (A–E) Induction of actin-based protrusions by dynamic APC clusters in REF52 cells. (A) A tip of an elongated process from the cell expressing EGFP-APC (green) and mCherry-F-tractin (grayscale). (B) Time-lapse frames for the boxed region in A. Encounters of EGFP-APC with the cell edge (green arrows 1, 2, and 5) or preexisting lamellipodia (green arrows 3 and 4) are followed by actin-rich protrusions (white arrows with matching numbers). Green arrows 2, 4, and 5 indicate the same APC cluster sequentially hitting the cell edge. Time is shown in min:s. (C and D) Representative kymographs from videos of cells expressing DsRed-cortactin with either EGFP-APC (C) or EGFP-EB3 (D). (C) Three APC tracks hit the cell edge (green asterisks); each is followed by cortactin-rich protrusions (magenta asterisks). FL APC, full-length APC; DsC, DsRed cortactin; cort, cortactin. (D) EB3-edge encounters are less efficient in inducing actin-rich protrusions. Scale arrows apply to both C and D. (E) Percentage of EB3-edge or APC-edge encounters followed within ∼30 s by actin- or cortactin-rich protrusions. Mean ± SD; n = 4 (EB3) and 8 (APC) independent experiments with a total number of 795 APC tracks and 545 EB3 tracks (unpaired t test with Welch's correction). Scale bars, 10 µm (A), 2 µm (B). (F–J) APC depletion in cultured rat hippocampal neurons. (F) Western blot of DIV14 neurons transfected at DIV1 with either control (shC), or APC-targeting (sh1 or sh2) shRNA and probed with indicated antibodies. The histone (H3) antibody is used as loading control. (G and H) Phalloidin staining of DIV14 neurons treated with control (sh Control) or APC-targeting (APC sh1) shRNAs. (H) Representative images of dendritic and axonal growth cones (GC). Scale bars, 50 µm (G) and 10 µm (H, all panels). (I) Average fluorescence intensity of phalloidin staining in axonal and dendritic growth cones of control and APC-depleted neurons at DIV14; mean ± SD; n (number of growth cones from 10–15 fields of view per experiment from three independent experiments for APC sh1 and two independent experiments for APC sh2, each with shControl) is shown in parenthesis for each sample; ****, P < 0.0001; ns, not significant. Kruskal–Wallis multiple comparisons test with post hoc Dunn’s test. (J) Dynamics of mCherry-F-tractin in growth cones of control and APC-depleted neurons. Time is shown in min. Scale bars, 5 µm.

