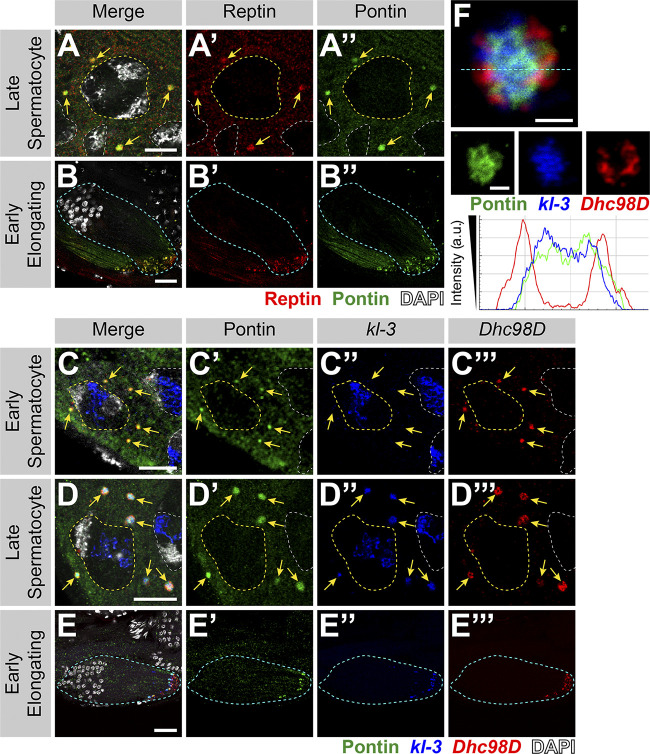
Figure 3.
Rept and Pont colocalize with kl-granules. (A and B) Rept and Pont colocalization in SCs (A) and early elongating spermatids (B). Shown are Rept (red), Pont (green), DAPI (white), SC nuclei (yellow dashed line, A), neighboring SC nuclei (white dashed line,; A), kl-granules (yellow arrows; C), and a spermatid cyst (cyan dashed line; B). Scale bars: 10 µm (A) or 25 µm (B). (C–E) Immunofluorescent staining combined with smFISH for Pont protein and kl-3 and Dhc98D mRNAs in early SCs (C), late SCs (D), and early elongating spermatids (E). Shown are Pont (green), kl-3 (blue), Dhc98D (red), DAPI (white), SC nuclei (yellow dashed line; C and D), neighboring SC nuclei (white dashed line; C and D), kl-granules (yellow arrows; C and D), and a spermatid cyst (cyan dashed line; E). Bar: 10 µm (C and D) or 25 µm (E). (F) Immunofluorescent staining combined with smFISH for Pont protein and kl-3 and Dhc98D mRNAs in a single kl-granule. Pont (green), kl-3 (blue), and Dhc98D (red). Intensity plot is shown for the region marked by the cyan dashed line. Scale bar: 1 µm.

