Figure 1.
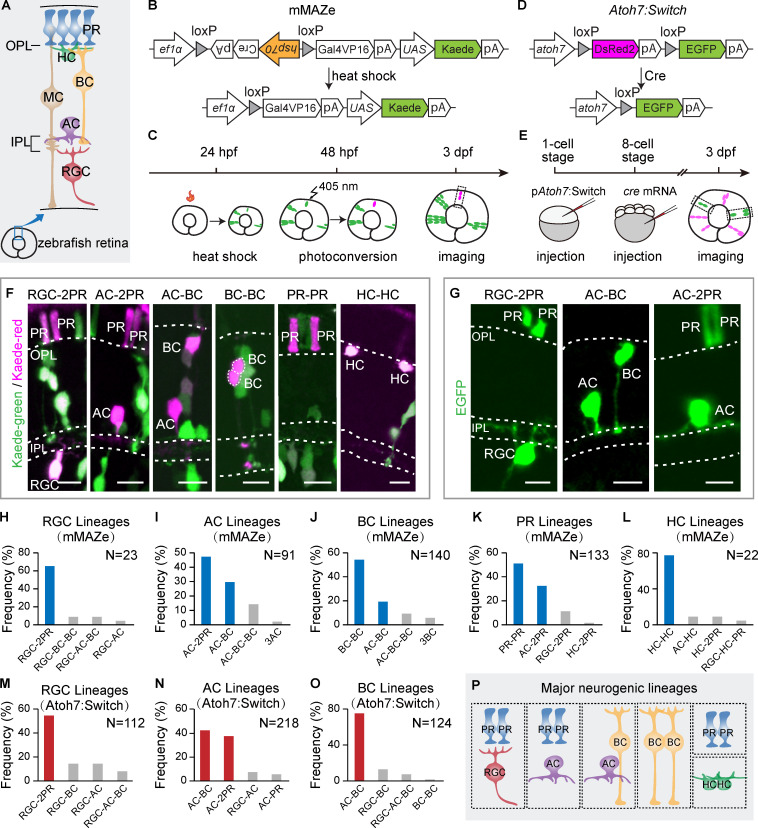
Major neurogenic lineages in the zebrafish retina. (A) Schematic of zebrafish retina structure. OPL, outer plexiform layer. IPL, inner plexiform layer. (B) Schematic of the mMAZe construct. (C) The working flow of lineage analysis of 48-hpf RPCs using mMAZe. (D) Schematic of the atoh7:Switch plasmid (pAtoh7:Switch). (E) The working flow of lineage analysis of atoh7+ PRCs using atoh7:Switch. (F) Representatives of major neurogenic lineages traced by mMAZe. (G) Representatives of major neurogenic lineages traced by atoh7:Switch. (H–L) The top four neurogenic lineages, which were analyzed using mMAZe and produce RGCs (H), ACs (I), BCs (J), PRs (K), or HCs (L) are listed. Major neurogenic lineages of each neuron type (frequency >15%) are highlighted in blue. (M–O) The top four lineages, which were analyzed using atoh7:Switch and produce RGCs (M), ACs (N), or BCs (O) are listed. Major neurogenic lineages of each neuron type (frequency >15%) are highlighted in red. (P) Summary graph of six major neurogenic lineages. Scale bars, 10 µm.

