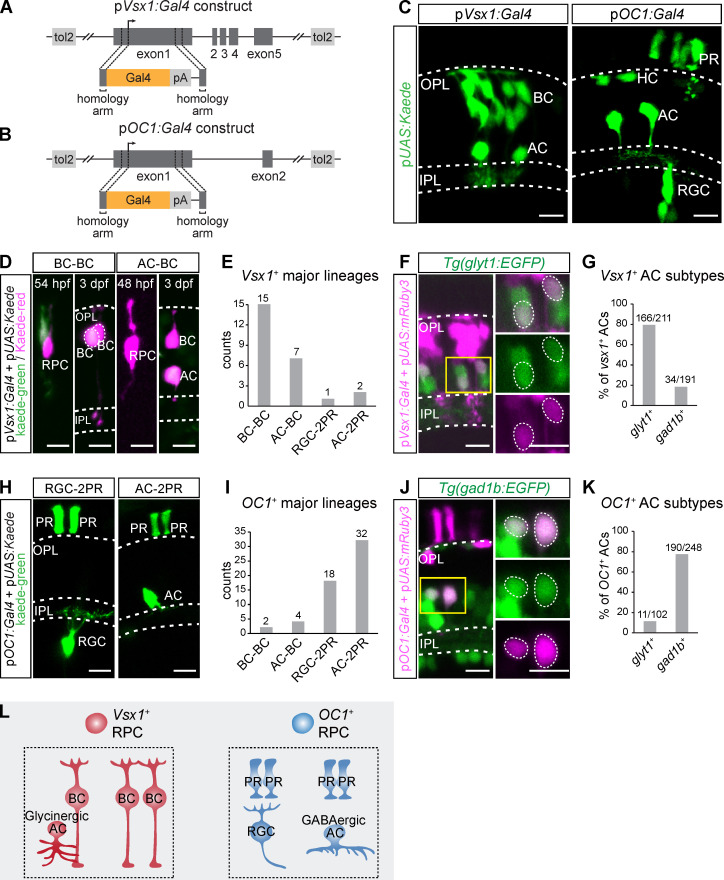
Figure 5.
Lineage tracing of vsx1+ and OC1+ RPCs. (A and B) Schematics of vsx1:Gal4 (A) and OC1:Gal4 (B) BAC constructs. (C) Vsx1+ cells and OC1+ cells in the retina at 3 dpf. (D and E) Lineage tracing of vsx1+ RPCs by the photoconversion of kaede-green to kaede-red at 48–54 hpf. Representative images are shown in D. The statistical result is shown in E. (F and G) Representative images (F) and the statistical result (G) show vsx1+ AC subtypes. (H and I) Lineage tracing of OC1+ RPCs by collecting spatially isolated lineages. Representative images are shown in H. The statistical result is shown in I. (J and K) Representative images (J) and the statistical result (K) show OC1+ AC subtypes. (L) A summary graphic illustrates lineage bias of vsx1+ and OC1+ PRCs. Scale bar, 10 µm.

