Figure 6.
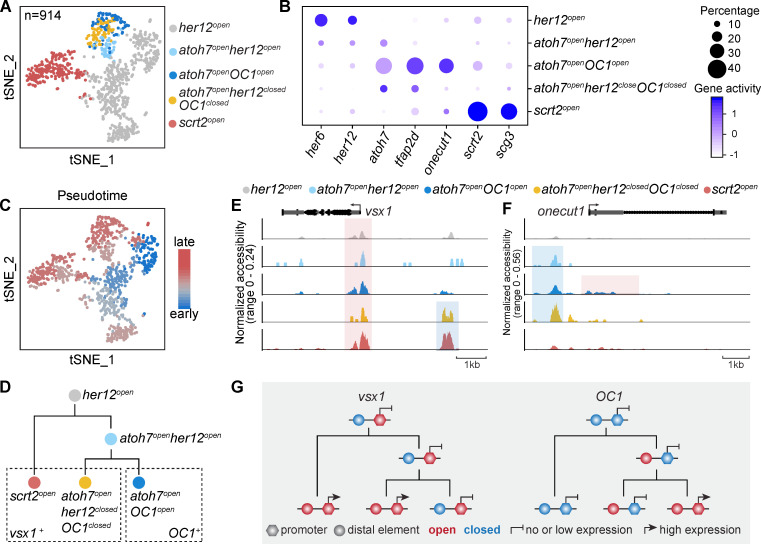
Different chromatin accessibility dynamics of vsx1 and OC1 in 48-hpf RPCs. (A) A t-SNE plot of 48-hpf RPCs based on their chromatin accessibility. Clusters are annotated by their specific chromatin accessibility. (B) A dot plot of gene activity of the clusters in A. (C) A t-SNE plot of 48-hpf RPCs based on their chromatin accessibility. Cells are colored by their pseudo-time. (D) A schematic illustrates the developmental trajectory and lineage markers of 48-hpf RPCs. (E and F) Coverage plots of proximal (highlighted in red) and distal (highlighted in blue) elements of vsx1 (E) and OC1 (F) in different clusters of 48-hpf RPCs. (G) A summary schematic shows the different chromatin accessibility dynamics of vsx1 and OC1 in 48-hpf RPCs.

