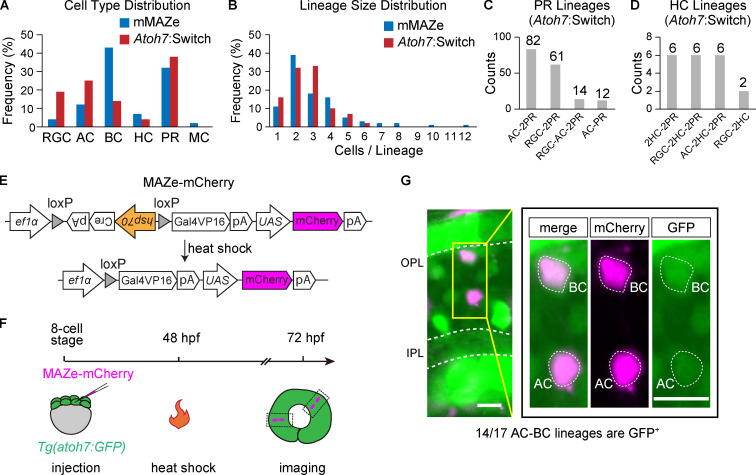
Figure S1.
Characteristics of lineages traced by mMAZe and atoh7:Switch. (A) Cell type distribution of lineages traced by mMAZe (1,595 cells in total) and atoh7:Switch (1,302 cells in total). (B) Size (the number of cells per lineage) distribution of lineages traced by mMAZe (n = 511) and atoh7:Switch (n = 484). (C) Top4 lineages traced by atoh7:Switch which produce PR(s). (D) Top4 lineages traced by atoh7:Switch which produce HCs. (E–G) Atoh7 expression in AC-BC lineages. (E) Schematics of MAZe-mCherry. (F) Workflow to analyze atoh7 expression in AC-BC. Sparse mCherry expression was achieved by heat shock at 48 hpf. Spatially isolated AC-BC lineages were analyzed at 72 hpf. (G) Atoh7 expression (labeled by GFP) in AC-BC lineages. Image in yellow rectangle was zoomed in on the right panel. All images presented are in Z-stack. Scale bar, 10 µm.

