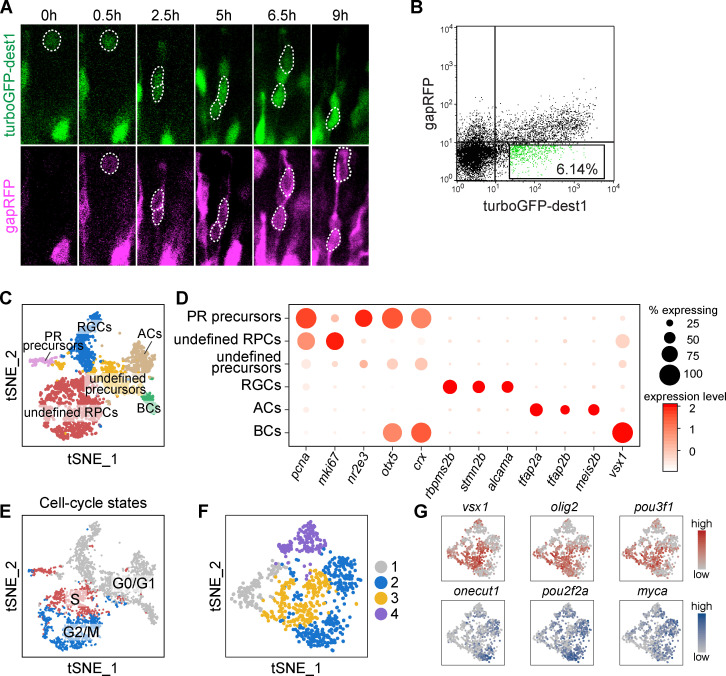
Figure S4.
Single-cell RNA sequencing of atoh7+ RPCs. (A) Time-lapse result of Tg(atoh7:turboGFP-dest1::atoh7:gapRFP) retina. TurboGFP-dest1 signal appears and disappears earlier than that of gapRFP. (B) FACS analysis of retinal cells from the Tg(atoh7:turboGFP-dest1::atoh7:gapRFP) embryos. The GFP+RFP− cells for scRNA-seq are highlighted. (C) The t-SNE plot showing the clustering result of GFP+RFP− cells in B and the annotation. (D) Featured genes of each cell cluster in C. (E) Cell-cycle distribution of cells in C. Cells during the same cell cycle phase tend to cluster together. (F) Four clusters of atoh7+ G2/M RPCs. (G) Expression patterns of cluster 2–specific (onecut1, pou2f2a, myca) and cluster 3–specific (vsx1, olig2, pou3f1) TFs of cells in F.

