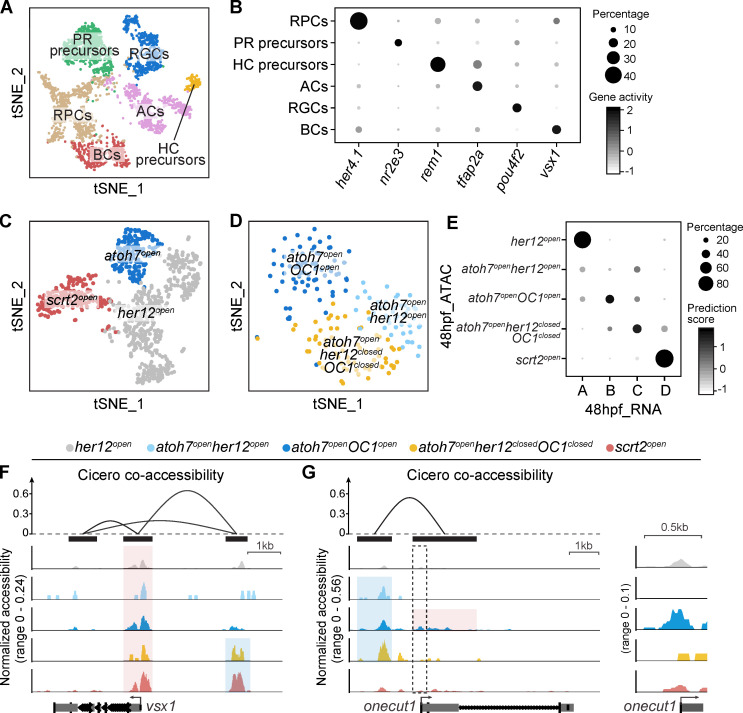
Figure S5.
ScATAC-seq of 48-hpf retina. (A and B) The clustering result of 48-hpf retinal cells. Clusters are shown in a t-SNE plot (A) and annotated by their specific gene activities. Gene activity patterns of all clusters are shown in a dot plot (B). (C and D) Clustering results of all RPCs (C) and atoh7open RPCs (D). (E) Correlation among the five RPC populations of 48-hpf scATAC-seq data (Fig. 6 A) and Clusters A–D of 48-hpf scRNA-seq data (Fig. 4 B) with the minimal prediction scores of 0.3. (F and G) Cicero co-accessibility among elements surrounding vsx1 (F, top) and OC1 (G, top). Peak positions are marked by black bars. The proximal opening (highlighted in red) and distal opening (highlighted in blue) in the 48-hpf RPCs are shown in the coverage plots. The proximal element of OC1 (marked by the dashed box) is magnified (G, right).

