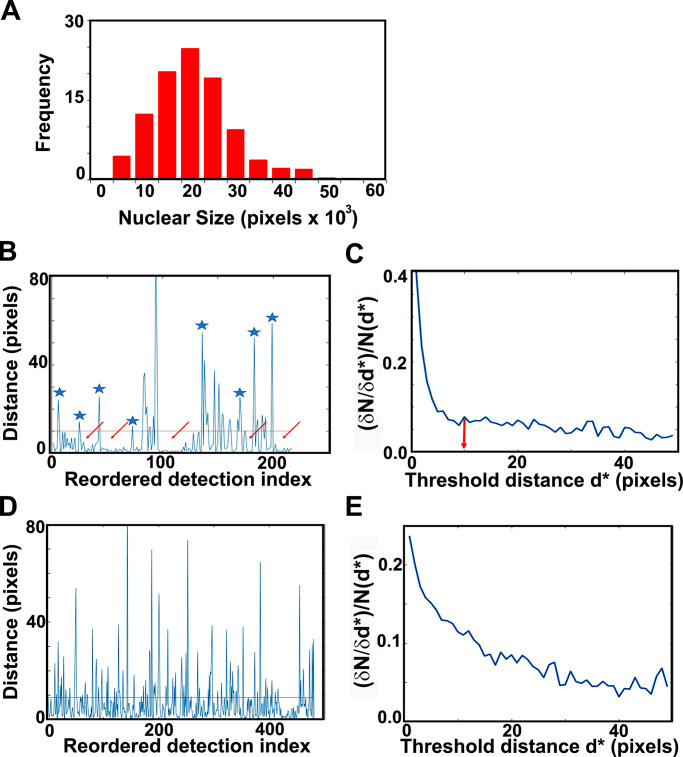
Figure 4.
G1/S TF cluster statistics. (A) Nuclear size distribution, as determined by our masking algorithm. Distribution of nuclear sizes (in pixel units; 1 pixel = 3 nm) obtained from our entire dataset of Mbp1-mEos3.2 cells grown in SC + 2% glucose medium. This distribution resembles the cell size distribution of asynchronously growing cultures; therefore, we used it as a proxy for cell size and in particular the size of G1/S cells (mode size, 20,000 pixels). Assuming spherical cells and nuclei, and the 1/7 karyoplasmic to cytoplasmic ratio (Jorgensen et al., 2007), this corresponds to a cell size of 30 fl. The Mbp1-mEos3.2 strain was chosen for this purpose, because unlike Swi4 and Swi6, Mbp1 nuclear signal shows no cell cycle dependence, yielding a (masked) nuclear size distribution that mirrors the entire cell size distribution. (B and C) Cluster quantification algorithm. Example calculations in B and C are for Swi4. (B) Distance to the next particle (vertical axis, in high resolution pixel units, 1 pixel = 3 nm) as a function of the position of the particle in the nearest-neighbor ranked list (see Materials and methods and supplemental figures for details). Clusters appear as valleys (arrows), wherein inter-particle distances fall below the chosen cluster detection threshold (10 pixels = 30 nm, red line), and are separated by larger distances (blue asterisks). (C) Relative variation of the number of clusters (vertical axis, cluster count change upon 3 nm threshold increment over initial cluster count ratio, (δN/δd*)/N(d*) as a function of the specific choice of the cluster detection threshold, d*, (horizontal axis, in high-resolution pixel unit, 1 pixel = 3 nm). (D and E) Quantification of NLS-mEos3.2-NLS PALM data reveals no significant clustering. (D) Distance to the next particle (vertical axis, in high-resolution pixel units, 1 pix = 3 nm) as a function of the position of the particle in the nearest-neighbor ranked list (see Materials and methods section for details). The absence of large valleys in this plot (as compared with B) is indicative of the absence of NLS-mEos3.2-NLS clustering. (E) Relative variation of the number of detected putative clustsers (vertical axis, cluster count change upon 3 nm threshold increment over initial cluster count ratio) as a function of the specific choice of the cluster detection threshold (horizontal axis, in high-resolution pixel unit, 1 pixel = 3 nm). The absence of obvious threshold value beyond which the relative cluster counts does not change is indicative of an even distribution of NLS-mEos3.2-NLS molecules, and of a lack of actual cluster formation.

