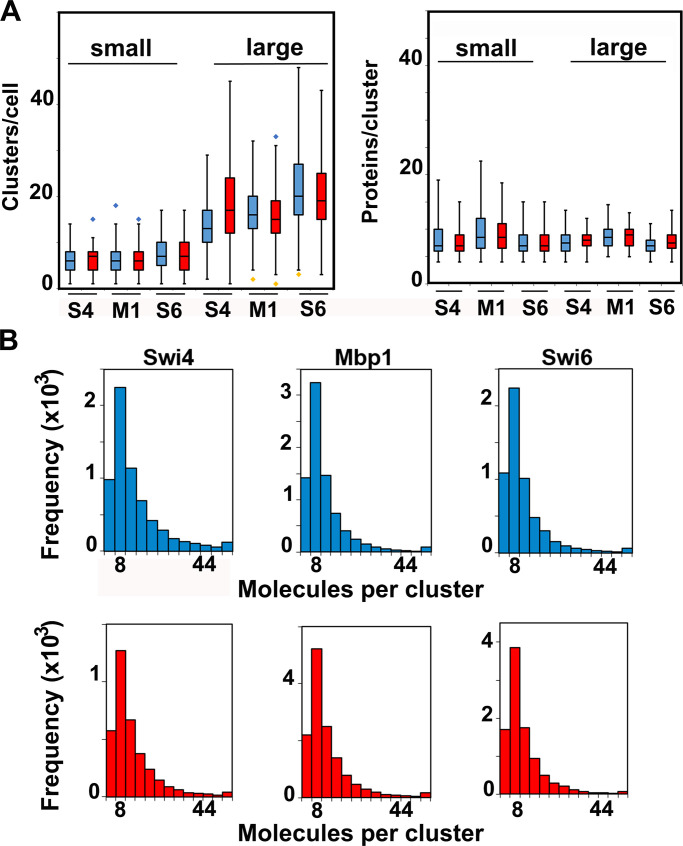
Figure 5.
Cluster statistics are largely independent of carbon source. (A) Number of clusters (left panel) and number of TF protein molecules per cluster (right panel) for Swi4-mEos3.2 (S4), Swi6-mEos3.2 (S6), and Mbp1-mEos3.2 (M1) in small cells (<20,000 pixels, left of each panel) and large cells (>20,000 pixels, right of each panel). Cells grown in glucose (blue) and glycerol (red). The box and whisker plots represent the distribution of values across three to five experiments, each encompassing >100 cells for each condition, and blue and yellow diamonds represent distribution outliers. The difference in cluster counts between small and large cells was statistically significant in each condition (P values <1e-40). There were significantly more Swi6-mEos3.2 clusters than Swi4-mEos3.2 or Mbp1-mEos3.2 clusters, in both large and small cells and in glucose and glycerol (P values ranging from 10e-23 to 0.0197). (B) Histograms showing molecular content for all clusters of Swi4-mEos3.2, Mbp1-mEos3.2, and Swi6-mEos3.2 as indicated in all nuclei for cells grown in SC + 2% glucose (blue) and SC + 2% glycerol (red). The frequency unit (vertical axis) is actual cluster counts within each bin across all datasets (3–5 experiments, >100 cells each) for each condition.

