Figure 6.
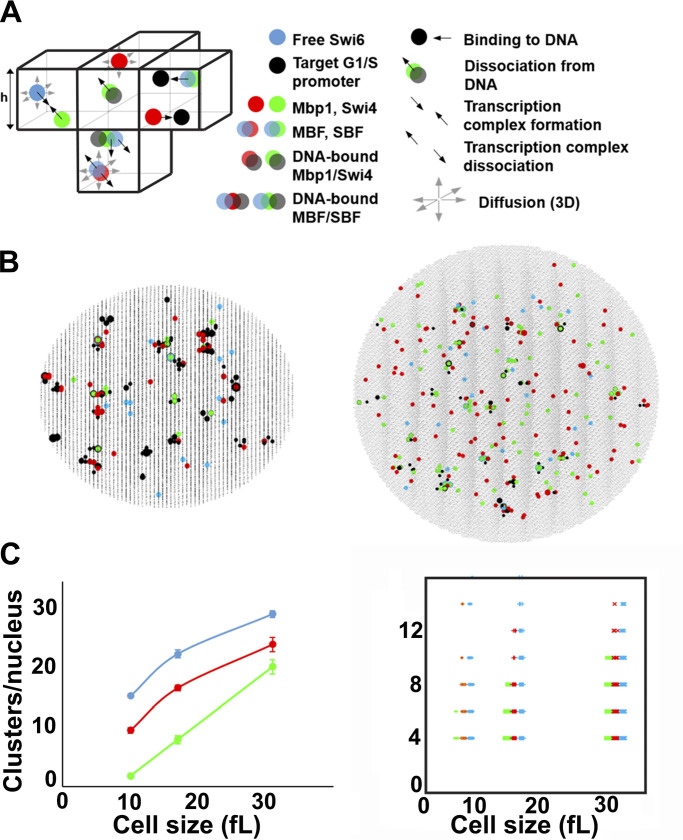
Stochastic modeling predicts Swi4, Mbp1, and Swi6 clustering. (A) Schematic of SBF/MBF binding model (left), encompassing mobile Swi4 dimers (green dots), Mbp1 dimers (red dots), Swi6 dimers (blue dots), and immobile G1/S DNA promoters (black dots), moving and interacting in the nucleus discretized in infinitesimal volume elements (cubes separated by thin black lines; only a few of them are shown here). Swi4/Mbp1 can associate with Swi6 to form mobile SBF/MBF, and/or bind (immobile) promoter DNA. For illustrative purposes, the leftmost element shows SBF formation from Swi4 and Swi6 (convergent thick black arrows). The bottommost element shows MBF dissociation into Mbp1 and Swi6 (divergent thick black arrows) and diffusion (thin gray arrows). Also shown is SBF dissociation from DNA. The rightmost element shows Mbp1 and SBF association with two promoters within a cluster. All interactions (i.e., promoter DNA binding and dissociation, complex formation and dissociation, diffusion) accounted for in the model are indicated (right). The corresponding propensities (in s-1) were derived from Bernstein (2005) and are listed below for all five reaction types respectively: , *, , *, and , where h is the mesh size, and the reaction “on” rates (and the equilibrium constants such that ) are defined in Materials and methods. (B) 2D projection of the 3D output of a typical simulation showing clusters of Swi4 dimers (green dots), Mbp1 dimers (red), Swi6 dimers (blue), and G1/S DNA promoters (black dots) in small (10 fl, left) and large (31.5 fl, right) cells. (C) Left: Number of Swi4 (green), Mbp1 (red), and Swi6 (cyan) clusters per nucleus (vertical axis) as a function of the size of simulated cells (horizontal axis). Data points indicate the cluster number averaged over 10 independent simulations for each cell size, while error bars indicate the standard error of the mean. Right: Scatter plot showing the number of Swi4 (green), Mbp1 (red), and Swi6 (cyan) molecules per cluster (vertical axis) as a function of the size of simulated cells (horizontal axis). Data points represent individual clusters and were gathered from 10 independent simulations for each cell size.

