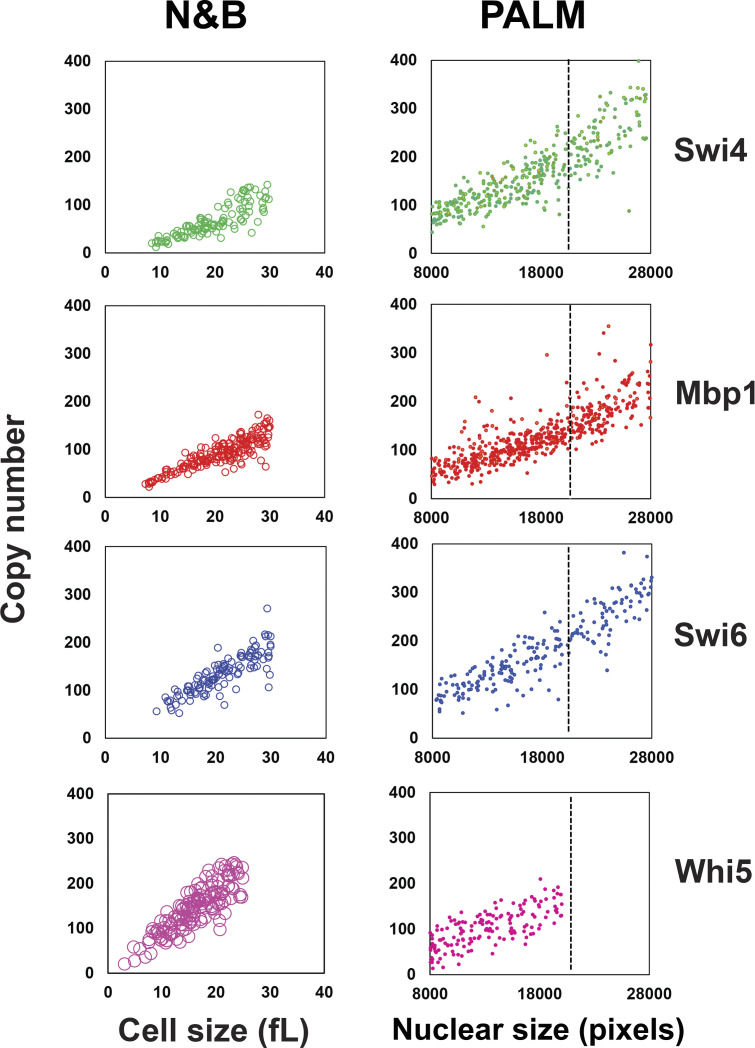
Figure S1.
Comparison of the copy numbers of Swi4-GFP, Mbp1-GFP, Swi6-GFP, and Whi5-GFP determined by scanning number and brightness and PALM. Left panels: Copy number vs. cell size (in fl) for Swi4, Mbp1, Swi6, and Whi5 as indicated, determined by scanning Number and Brightness (sN&B; Dorsey et al., 2018). Only G1 cells are shown. Right panels: Copy number vs. nuclear size (in pixels) determined by PALM for Swi4-mEos3.2, Mbp1-mEos3.2, Swi6-mEos3.2, and Whi5-mEos3.2 as indicated. A dotted line has been placed at the critical cell size below which the majority of cells are in G1 phase. As cells become larger, the efficiency of PALM detection decreases due to out-of-focus and hence undetected molecules. This effect is particularly clear for Mbp1 and Swi6.

