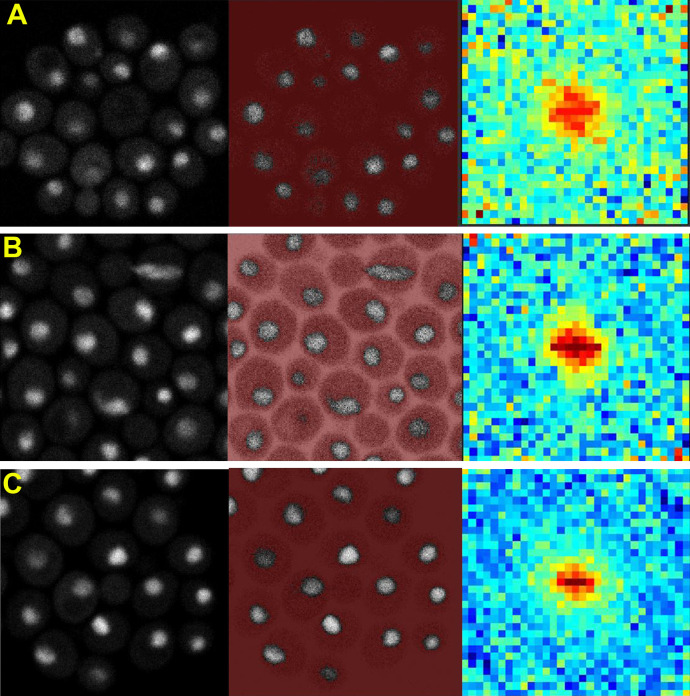
Figure S3.
ARICS analysis of diffusion of G1/S TF-GFP fusion constructs. (A–C) Strains expressing GFPmut3 fusion constructs of Swi4, Mbp1, and Swi6 from their natural loci were as previously described (Dorsey et al., 2018). ARICS analysis (Hendrix et al., 2016) allows RICS analysis of arbitrary regions of an FOV. ROI were selected based on intensity threshold values that selected only pixels in the nuclei. Spatio-temporal correlation of the intensity values was performed as described previously (Digman et al., 2005). Left panels correspond to grayscale intensity images. Middle panels correspond to arbitrary thresholding in which only gray pixels are analyzed and red pixels are eliminated. Right panels show the RICS image. (A) Swi4-GFPmut3, (B) Mbp1-GFPmut3, and (C) Swi6-GFPmut3. Cells were grown in SC + 2% glucose medium. Note that RICS analysis is limited to timescales faster than ∼50 ms, with any slower dynamics appearing to be immobile on the RICS timescale. Thus, these spatio-temporal correlation patterns are a signature of TF motion at shorter timescales.

