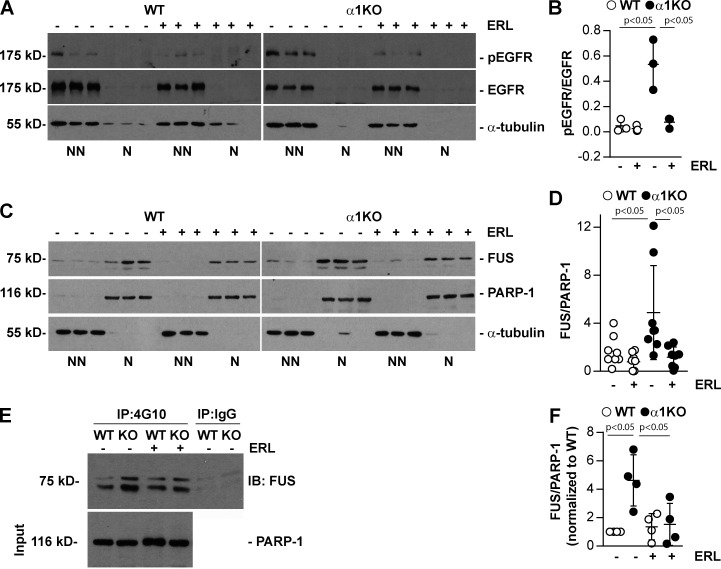
Figure 3.
Inhibition of EGFR reduces FUS nuclear levels. (A and C) Serum-starved WT and Itgα1KO mesangial cells (n = 3 samples) were untreated or treated with Erlotinib (ERL, 5 µM for 18 h). Nonnuclear (NN) and nuclear (N) fractions (20 µg/lane) were analyzed by Western blot for levels of FUS, pEGFR, and total EGFR. PARP-1 or α-tubulin was analyzed to evaluate fraction purity. (B and D) Nonnuclear pEGFR and total EGFR or nuclear FUS and PARP-1 bands were quantified by densitometry, and values represent pEGFR/EGFR or FUS/PARP-1 ratio. Circles represent individual values (one representative experiment performed in triplicate is shown in B, two experiments performed in triplicate are shown in D), and bars represent mean ± SD. (E) Nuclear fractions (400 µg) from WT and Itgα1KO cells, treated as indicated above, were immunoprecipitated (IP) with anti-4G10 antibody or IgG control, and the immunoprecipitates were analyzed by Western blot for levels of FUS. Input represents nuclear lysates (20 µg/lane) analyzed for levels of PARP-1. (F) Immunoprecipitated FUS and PARP-1 bands were quantified by densitometry, and values represent FUS/PARP1 ratio normalized to WT cells. Circles represent single values (n = 4 experiments performed) and bars represent mean ± SD. One-way ANOVA and two-tailed t test were used for statistical analysis.

