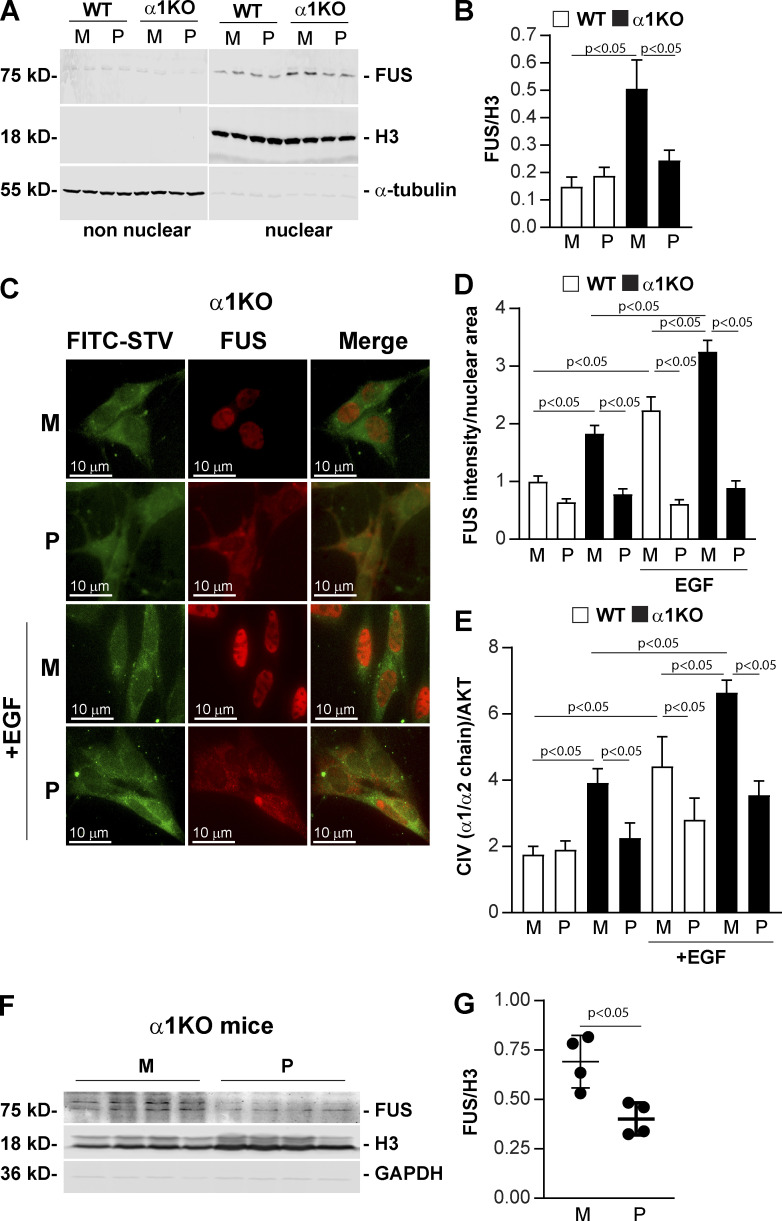
Figure 8.
Cell-penetrating FUS-NLS peptides inhibit FUS nuclear translocation and collagen IV synthesis. (A) Analysis of FUS subcellular localization in WT and Itgα1KO mesangial cells (n = 2 per treatment shown) treated with biotin-labeled CP-FUS-NLS (AAVALLPAVLLALLAPK(Biot)RRGEHRQDRRERPY, P) or inactive CP-mutFUS-NLS (AAVALLPAVLLALLAPK(Biot)REGEHREDREERGA, M), both at 0.4 µM. After 1 h, nonnuclear and nuclear fractions (20 µg/lane, n = 2 samples) were analyzed by Western blot for content of FUS, H3 (nuclear marker) or α-tubulin (nonnuclear marker). (B) Nuclear FUS and H3 bands were quantified by densitometry, and values represent the FUS/H3 ratio. Values are the mean ± SEM of four experiments performed at least in duplicate. (C) Immunofluorescence tracking FUS in serum-starved WT and Itgα1KO mesangial cells. Cells were treated with biotinylated cell-penetrating WT (P) or mutated (M) FUS-NSL (both at 0.2 µM) and left unstimulated or stimulated with EGF (20 ng/ml). After 1-h treatment, cells were fixed, permeabilized, and incubated with anti-FUS antibody (red) and FITC-conjugated streptavidin (green). (D) The intensity of nuclear FUS was analyzed using ImageJ, and values represent FUS intensity/nuclear area. Bars and errors are mean ± SEM of two experiments with 112–167 cells analyzed in each group. (E) Serum-starved HEK293 cells treated with cell-penetrating biotinylated WT (P) or mutated (M) FUS-NSL peptide (both at 0.4 µM) were left untreated or treated with EGF (20 ng/ml). After 24 h, the levels of collagen IV (CIV) and AKT in total cell lysates (40 µg/lane) were analyzed by Western blot. CIV and AKT bands were quantified by densitometry, and values represent CIV/AKT ratio. Bars and errors are mean ± SEM of three experiments performed at least in duplicate. (F) Itgα1KO male mice (n = 4) received i.p. injections of cell-penetrating biotinylated WT (P) or mutated (M) FUS-NSL peptide (35.67 µg/g body weight and 33.82 µg/g body weight for WT and mutated FUS-NLS peptide, respectively) twice a day. After 3 d, kidney nuclear fractions (30 µg/lane) were analyzed by Western blot for levels of FUS, H3, and GAPDH. (G) FUS and H3 bands were quantified by densitometry, and values are expressed as FUS/H3 ratio. Bars and errors are mean ± SEM of four mice. One-way ANOVA and two-tailed t test were used for statistical analysis.

