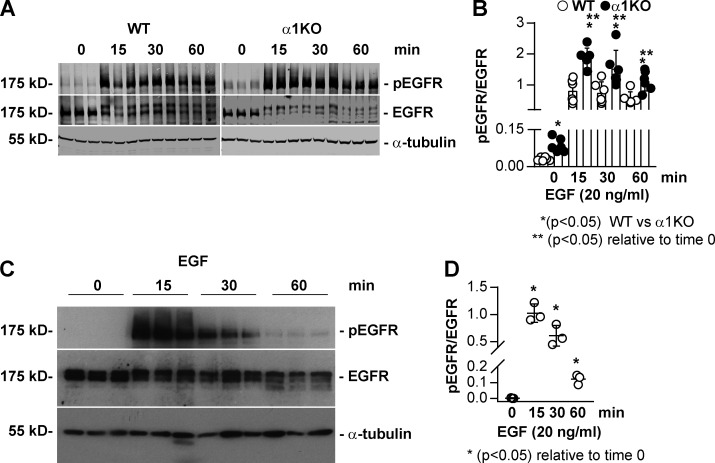
Figure S4.
Increased baseline and EGF-induced EGFR phosphorylation in Itgα1KO mesangial cells. (A and C) Serum-starved WT and Itgα1KO mesangial (A) or HEK293 (C) cells were treated with EGF (20 ng/ml) for the times indicated. Equal amounts of lysate (40 µg/lane) were analyzed by Western blot for levels of phosphorylated and total EGFR as well as α-tubulin to verify equal loading. (B and D) pEGFR and EGFR bands were quantified by densitometry. Values represent pEGFR/EGFR ratio and are mean ± SD of two experiments performed in triplicate (B) or one representative experiment performed in triplicate (D). One-way ANOVA and two-tailed t test were used for statistical analysis.

