Figure 5.
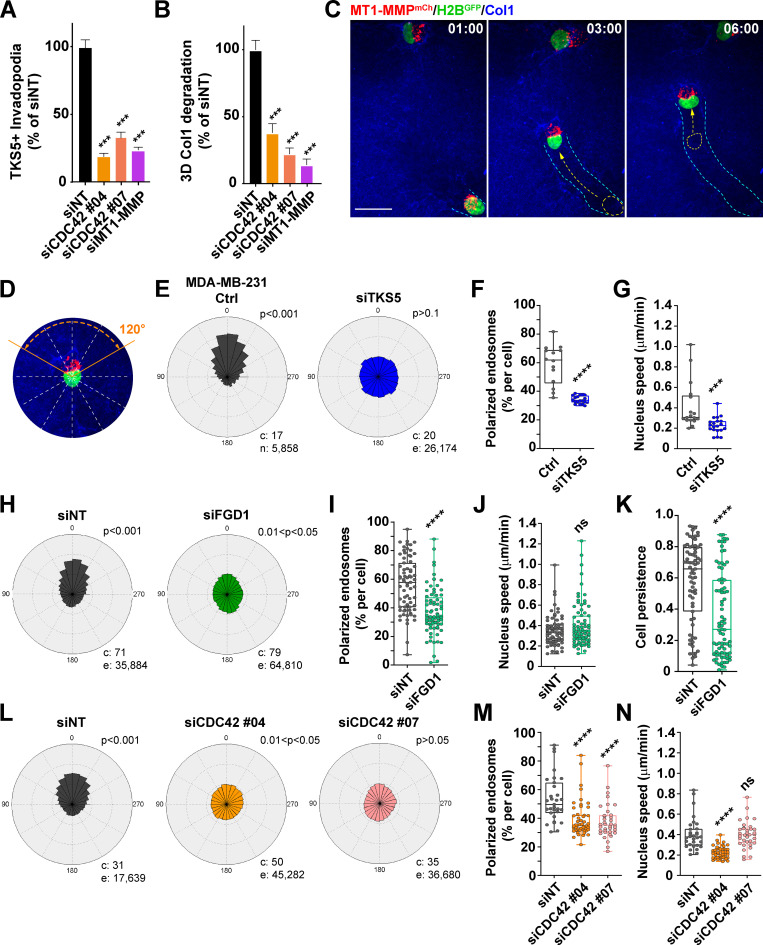
A TKS5/FGD1/CDC42 axis is required for cell polarization during 3D collagen invasion. (A) Quantification of TKS5-positive invadopodia in siRNA-treated MDA-MB-231 cells as indicated. siNT, n = 238 cells; siCDC42#04, n = 88 cells; siCDC42#07, n = 48 cells and siMT1-MMP, n = 68 cells from three independent experiments. (B) Pericellular collagenolysis by MDA-MB-231 cells treated with the indicated siRNAs. siNT, n = 50 cells; siCDC42#04, n = 21 cells; siCDC42#07, n = 25 cells and siMT1-MMP, n = 16 cells from three independent experiments. Statistical analysis in A and B was based on Kruskal-Wallis test. (C) MDA-MB-231 cells expressing MT1-MMPmCh (red) and H2BGFP (green) were embedded in the 3D collagen gel (blue) and analyzed by real-time spinning disk confocal microscopy. The gallery shows nonconsecutive frames from a representative video obtained from three independent experiments (time in hour:minute). Arrows show the direction of movement from the previous image. The cyan dotted lines represent the cell track over time. The position of the nucleus in the previous image is shown by a yellow dotted line with an arrow representing the nucleus movement. Scale bar, 10 µm. (D) MDA-MB-231 cell expressing MT1-MMPmCh (red) and H2BGFP (green) embedded in the 3D collagen gel (blue). The cell is divided in 30° sectors, with the 0° axis representing the direction of nucleus movement. (E, H, and L) Rose plots showing the percentage of MT1-MMPmCh-positive LE/Lys in 30° sectors relative to the direction of nucleus movement (0°) scored from time-lapse sequences of MT1-MMPmCh/H2BGFP-expressing MDA-MB-231 cells or cells treated with TKS5 or FGD1 siRNA or control siNT siRNA invading in the 3D collagen gel. c, number of cells; e, number of endosomes analyzed from three independent experiments. P values for circular uniformity Rao’s spacing tests are shown. (F, I, and M) Percentage of MT1-MMPmCh-positive LE/Lys in a 120° sector in front of the nucleus in the direction of movement (as in D). Data were analyzed using t test (F and I) or one-way ANOVA (M). (G, J, and N) H2BGFP-positive nuclei were automatically tracked from the time-lapse sequences obtained from three independent experiments, and the plots show the distribution of nuclei speed. Data were analyzed using t test (G and J) or one-way ANOVA (N). (K) Persistence of nucleus movement computed from the H2BGFP-positive nuclei trajectories. Data were analyzed using t test. ***, P < 0.001; ****, P < 0.0001; ns, not significant.

