Figure 1.
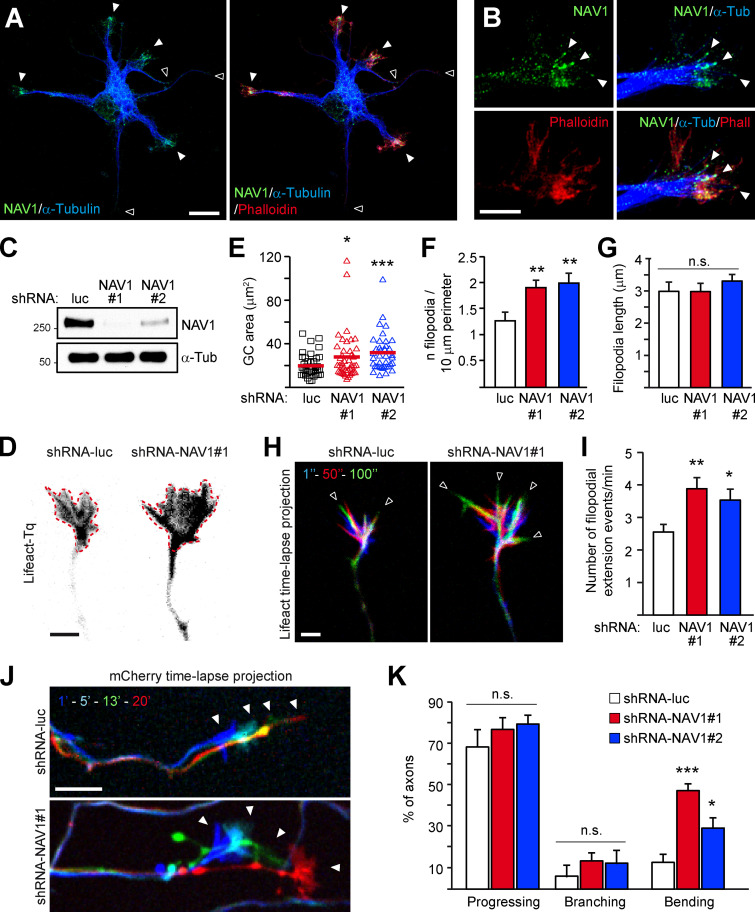
NAV1 controls GC dynamics and axon bending. (A and B) Immunostaining of NAV1, MTs (α-tubulin), and F-actin (phalloidin) in E14.5 cultured cortical neurons (2 DIV). (A) Closed arrowheads mark neurite tips enriched with F-actin and NAV1. Open arrowheads mark neurite tips devoid of F-actin and NAV1. Scale bar, 10 µm. See also Fig. S1 A. (B) High-resolution images of an axonal GC. Arrowheads point to MT plus ends embedded in F-actin and decorated with NAV1. Scale bar, 5 µm. See also Fig. S1 B. Results were replicated in 30 neurons and 12 GCs from two independent cultures. (C) Immunoblots of lysates of cultured cortical neurons (3 DIV) transduced with the indicated shRNAs by lentiviral infection at 0 DIV. α-tubulin was used as a loading control. (D–I) Axonal GCs of cortical neurons (3 DIV) transfected with Lifeact-Tq and the indicated shRNAs and imaged by time-lapse microscopy during 2 min. (D) Lifeact-Tq images of GCs of control and NAV1-depleted neurons. Dashed red lines outline the GC areas. Scale bar, 2 µm. See also Video 1. (E–G) Quantifications of GC area (E), density of filopodia (F), and average filopodia length (G). See also Fig. S2. (H) Color-coded time-lapse projections of the Lifeact-Tq signal. The indicated time points were used. Arrowheads mark filopodia. Scale bar, 2 µm; time, seconds. See also Video 1. (I) GC dynamics of control and NAV1-depleted neurons. n = 39 (shRNA-luc), 43 (shRNA-NAV1#1), and 38 (shRNA-NAV1#2) GCs from four independent experiments. (J and K) Axonal GCs of cortical neurons (3 DIV) transfected with the indicated shRNAs and imaged by time-lapse microscopy for 20 min. (J) Color-coded time-lapse projections of the mCherry reporter in GCs. The indicated time points were used. Arrowheads mark positions of the GCs. Scale bar, 10 µm; time, minutes. See also Video 2. (K) Proportion of axons showing net progression, branching, or bending. Only the axons showing net progression were scored as branching or bending. n = 61 (shRNA-luc), 72 (shRNA-NAV1#1) and 61 (shRNA-NAV1#2) axons from four independent experiments. All bar histograms show means ± SEM. Dot plot shows means. Analyzed by two-tailed Student's t test. n.s., nonsignificant.

