Figure 2.
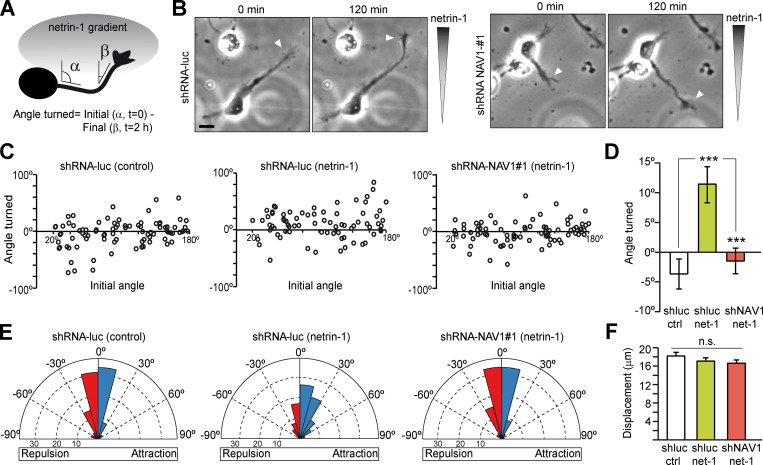
NAV1 mediates netrin-1–evoked GC turning. Cortical neurons were transduced with the indicated shRNAs by lentiviral infection at 0 DIV and imaged at 2 DIV by phase-contrast microscopy for 2 h while being exposed to a gradient of 200 ng/ml netrin-1 in a Dunn chamber. (A) The angle turned by each axon was defined by the initial (α) and final (β) angles of the distal segment of the axon respective to a line parallel to the gradient. Angle turned >0° indicates attraction, and <0° indicates repulsion. (B) Control and NAV1-depleted neurons in the Dunn chamber imaged at the beginning (0 min) and end (120 min) of the assay. Arrowheads point to the axon tips. Netrin-1 concentration increases along the vertical axis of images. Scale bar, 20 µm. See also Video 3. (C) Scatter plot of the angle turned compared with the initial angle of axons for initial angles >20°. (D) Mean angle turned by axons analyzed in C. (E) Rose histograms depicting the distribution of angles turned by axons. Angles were clustered in bins of 15°, and the proportion of axons per bin is represented by the radius of each segment. Blue bins indicate attraction, and red bins indicate repulsion. (F) Axon length of neurons from C. n = 87 (shRNA-luc/BSA), 76 (shRNA-luc/netrin-1), and 80 (shRNA-NAV1#1/netrin-1) axons from three independent experiments. Bar histograms show means ± SEM. Analyzed by two-tailed Student's t test.

