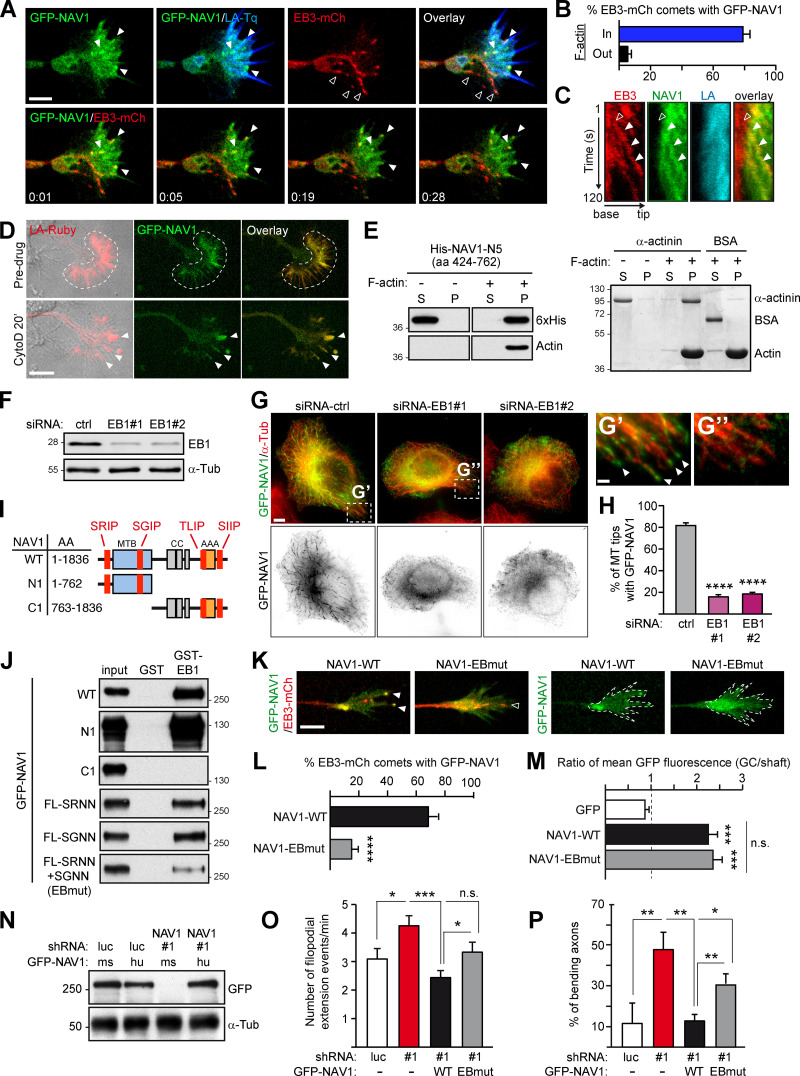
Figure 3.
NAV1 is an actin-binding +TIP that requires MT plus-end tracking to control GC dynamics. (A) Top: Axonal GC of a cortical neuron (2 DIV) cotransfected with GFP-NAV1, EB3-mCherry, and Lifeact-Tq. Bottom: Time-lapse composition of the GFP-NAV1/EB3-mCherry overlay. Closed arrowheads point to EB3/NAV1-positive MT plus ends (comets) inside F-actin. Open arrowheads mark EB3-positive/NAV1-negative MT plus ends outside F-actin. Scale bar, 5 µm; time, minutes:seconds. See also Video 4. (B) Percentage of EB3-mCherry comets decorated by GFP-NAV1 inside and outside F-actin in GCs as in A. n = 159 total EB3-mCherry comets analyzed in 28 GCs from five independent experiments. (C) Kymographs obtained from a GC from A. NAV1 (green) tip-tracks MTs (red) only inside F-actin (blue). Arrowheads mark an EB3-mCherry comet outside (open) and inside (closed) F-actin. (D) Time-lapse composition of the axonal GC of a cortical neuron (2 DIV) cotransfected with GFP-NAV1 and Lifeact-Ruby, before and after exposure to cytochalasin D (CytoD) for 20 min. Dashed lines delineate the F-actin-rich P-domain. Arrowheads point to the aggregates of F-actin and NAV1 protein after cytochalasin D treatment. Scale bar, 10 µm. Averaged Pearson´s coefficient = 0.48 ± 0.24 (before cytochalasin D); 0.66 ± 0.16 (after cytochalasin D); n = 11 GCs from two independent experiments. (E) Immunoblots of the soluble (S) and pellet (P) fractions of an in vitro F-actin cosedimentation assay with purified His-NAV1-N5 fragment (left). BSA and α-actinin were used as a negative and positive control and visualized by Coomassie staining (right). Results were replicated three times. See also Fig. S4. (F–H) Localization of GFP-NAV1 in EB1-depleted HeLa cells. (F) Immunoblots of lysates of HeLa cells transfected with the indicated siRNAs. α-Tubulin was used as a loading control. (G–G′′) HeLa cells cotransfected with the indicated siRNAs and GFP-NAV1 and stained with an anti-α-tubulin antibody. Arrowheads point to MT tips decorated with GFP-NAV1. Scale bars, 5 and 1 µm. (H) Percentage of MT tips decorated with GFP-NAV1 in cells from G. n = 246 (siRNA-ctrl), 350 (siRNA-EB1#1), and 326 (siRNA-EB1#2) MT tips from 26 (siRNA-ctrl), 20 (siRNA-EB1#1), and 20 (siRNA-EB1#2) cells from two independent experiments. (I) GFP-NAV1 constructs used in J. AAA+, predicted ATPase domain; CC, coiled coil; MTB, predicted MT-binding domain. SRIP, SGIP, TLIP, and SIIP are SxIP motifs. (J) Anti-GFP immunoblots of GST-EB1 affinity pull-down assays with the indicated truncated or mutated forms of GFP-NAV1 expressed in HEK293T cells. A GST column was used as a control. FL-SRNN+SGNN is NAV1-EBmut. Results were replicated three times. (K) Time-lapse microscopy of axonal GCs of cortical neurons (2 DIV) transfected with EB3-mCherry, Lifeact-Tq, and the indicated forms of GFP-NAV1. Dashed lines outline Lifeact-Tq regions (not depicted). Arrowheads point to EB3/NAV1-positive (closed) and EB3-positive/NAV1-negative (open) MT plus ends. Scale bar, 5 µm. See also Video 5. (L) Percentage of EB3-mCherry comets decorated with GFP-NAV1 in GCs from K. n = 69 (WT) and 82 (EBmut) EB3-mCherry comets from 31 (WT) and 35 (EBmut) GCs from three independent experiments. (M) Ratio of mean GFP fluorescence intensity between the Lifeact-delineated area and the axon shaft of GCs from K. n = 32 (GFP), 34 (WT), 36 (EBmut) GCs from three independent experiments. (N–P) Rescue experiments of NAV1-depletion phenotypes shown in Fig. 1, I and K. (N) Immunoblots of lysates of HEK293T cells cotransfected with the indicated shRNAs and GFP-NAV1 constructs. α-Tubulin was used as a loading control. Human GFP-NAV1 expression is resistant to shRNA-NAV1#1. ms, mouse; hu, human. (O) Dynamics of axonal GCs as in Fig. 1 I. n = 29 (shRNA-luc), 35 (shRNA-NAV1#1), 32 (WT rescue), and 32 (EBmut rescue) GCs from three independent experiments. (P) Percentage of axons bending as in Fig. 1 K. n = 45 (shRNA-luc), 57 (shRNA-NAV1#1), 46 (WT rescue), and 42 (EBmut rescue) axons from three independent experiments. Histograms show means ± SEM. Analyzed by two-tailed Student's t test.

