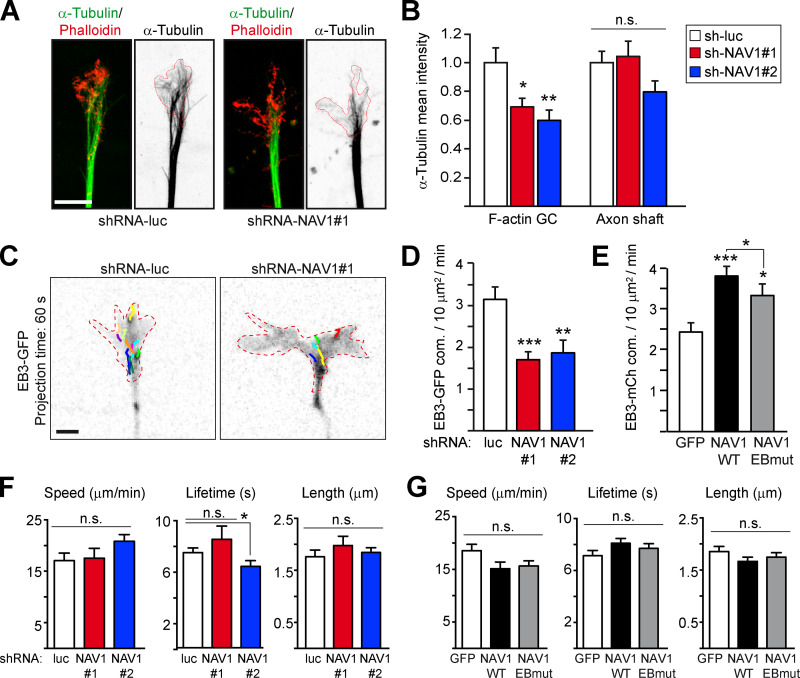
Figure 4.
NAV1 promotes the persistence of MTs in the P-domain of GCs. (A) Immunostaining of MTs (α-tubulin) and F-actin (Phalloidin) in axonal GCs of cortical neurons (3 DIV) transduced with the indicated shRNAs by lentiviral infection at 0 DIV. Red lines delineate phalloidin-positive areas. Scale bar, 5 µm. (B) Mean MT fluorescence intensity inside the F-actin–delineated areas of GCs and in the axon shafts of neurons from A. Values are normalized to control. n = 29 (shRNA-luc), 31 (shRNA-NAV1#1,) and 18 (shRNA-NAV1#2) GCs from four independent experiments. (C) EB3-GFP time-lapse projections with comet tracks from axonal GCs of cortical neurons (3 DIV) transfected with EB3-GFP, Lifeact-Tq, and the indicated shRNAs. Dashed lines delineate Lifeact-Tq areas (not shown). Scale bar, 2 µm. (D) Density of EB3-GFP comets inside F-actin. n = 35 (shRNA-luc), 33 (shRNA-NAV1#1), and 29 (shRNA-NAV1#2) GCs from four independent experiments. (E) Density of EB3-mCherry comets inside F-actin in GCs of cortical neurons (2 DIV) transfected with EB3-mCherry, Lifeact-Tq, and the indicated forms of GFP-NAV1, and imaged as in C. n = 42 (GFP), 51 (WT), and 33 (EBmut) GCs from five independent experiments. (F and G) plusTipTracker analysis of the EB3 comet dynamics inside F-actin–rich areas of GCs imaged in D and E, respectively. n = 13 (shRNA-luc), 8 (shRNA-NAV1#1), and 9 (shRNA-NAV1#2) GCs from three independent experiments. n = 22 (GFP), 24 (WT), and 27 (EBmut) GCs from three independent experiments. Histograms show means ± SEM. Analyzed by two-tailed Student's t test.

