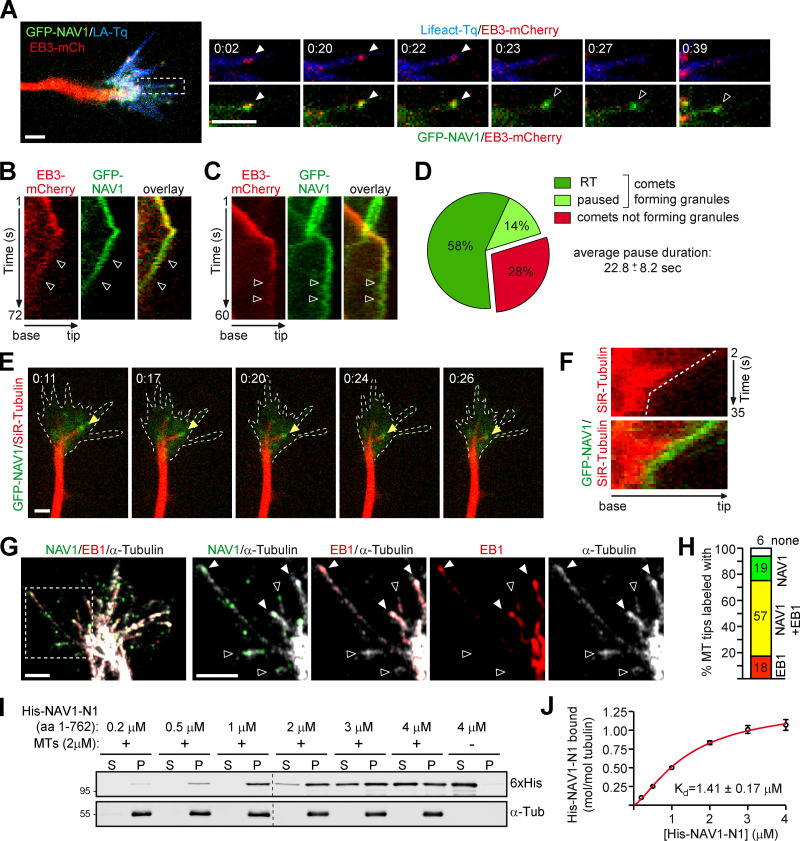
Figure 5.
NAV1 binds directly and persists at the plus end of nongrowing MTs. (A) Left: Axonal GC of a cortical neuron transfected with GFP-NAV1, EB3-mCherry, and Lifeact-Tq. Right: Time-lapse composition of the EB3-mCherry/Lifeact-Tq and EB3-mCherry/GFP-NAV1 overlays from one filopodium (white box). Closed arrowheads point to a polymerizing EB3/NAV1-positive MT plus end, and open arrowheads point to the NAV1 granular signal sliding backward after the EB3 signal fades up. Scale bars, 2 µm; time, minutes:seconds. See also Videos 4 and 5. (B) Kymographs from the filopodium shown in A. Arrowheads mark the backward motion of the EB3-negative NAV1 granule. (C) Kymographs from the filopodium shown in Video 7. Arrowheads mark a pausing EB3-negative NAV1 granule. (D) Percentage of NAV1/EB3-positive comets turning into EB3-negative NAV1 granules and the proportion of those undergoing retrograde translocation (RT) or pause. The average duration of the NAV1 granule pauses is also detailed. n = 60 total EB3/NAV1-positive comets in 26 GCs from five independent experiments. (E) Time-lapse composition of the axonal GC of a cortical neuron (2 DIV) transfected with GFP-NAV1 and Lifeact-Tq and incubated with SiR-tubulin (MT in red). Arrowheads point to a NAV1 granule at the retracting tip of an MT. F-actin area is defined with dashed lines. n = 56 NAV1 granules tracked in 26 GCs from three independent experiments. Scale bar, 2 µm; time, minutes:seconds. See also Video 8. (F) Kymographs of the MT pointed to in E depicting the coordinated motion of the NAV1 granule (green) and the MT tip (red). (G) Immunostaining of NAV1, EB1, and MTs (α-tubulin) in the axonal GC of a cortical neuron (2 DIV). The dashed square outlines the magnified area. Closed arrowheads point to EB1/NAV1-labeled MT plus ends, and open arrowheads point to MT plus ends that are labeled with NAV1 only. Scale bars, 2 µm. (H) Percentage of MT plus ends at the P-domain in G that are labeled with NAV1 only, EB1/NAV1, EB1 only, or free. n = 80 MT plus ends in 15 axonal GCs. (I) Immunoblots of the soluble (S) and pellet (P) fractions of an in vitro MT cosedimentation assay with purified His-NAV1-N1 fragment. Results were replicated three times. (J) Saturation binding curve for His-NAV1-N1 and the equilibrium dissociation constant (Kd) calculated as described in Materials and methods.

