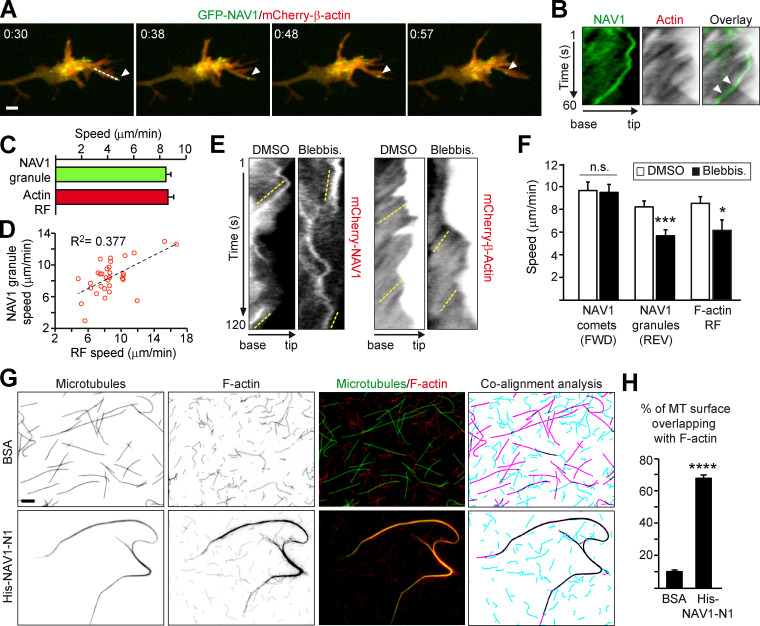
Figure 6.
NAV1 crosslinks nonpolymerizing MT plus ends to actin filaments in filopodia. (A) Time-lapse composition of the axonal GC of a cortical neuron transfected with GFP-NAV1 and mCherry-β-actin. Arrowheads mark a NAV1 granule inside a filopodium. Scale bar, 2 µm. time, minutes:seconds. (B) Kymographs generated from A (dashed line) to measure the speed of NAV1 granules and the F-actin RF. Arrowheads point to a granule aligned with the RF lines. (C) Average speed of NAV1 granules and the RF from B. n = 32 GFP-NAV1 granules in 20 GCs from three independent experiments. (D) Correlation between NAV1 granules and RF speeds in each filopodium from B. P < 0.01 in a Spearman correlation test. (E) Kymographs obtained from the filopodia of axonal GCs of cortical neurons (2 DIV) transfected with either mCherry-NAV1 or mCherry-β-actin and treated with blebbistatin or DMSO. Dashed yellow lines mark the retrograde motion of NAV1 granules and the RF. (F) Average speed of the NAV1 comets (FWD) and granules (REV) measured in kymographs from E. n = 41 comets and 45 granules in 26 GCs (DMSO), and 38 comets and 42 granules in 28 GCs (blebbistatin), from three independent experiments. Average speed of the RF measured in kymographs from E. n = 21 (DMSO) and 13 (blebbistatin) filopodia in 18 and 15 GCs, respectively, from two independent experiments. (G) Fluorescently labeled Taxol-stabilized MTs (green) and phalloidin-stabilized actin filaments (red) incubated with 0.2 µM His-NAV1-N1 fragment or BSA as a negative control. The masked images (right panel) represent MTs (magenta), actin filaments (turquoise), and their overlapping areas (black). Scale bar, 5 µm. (H) Quantification of the percentage of MT surface overlapping with F-actin from G. n = 28 (BSA) and 25 (His-NAV1-N1) images from two independent experiments. Histograms show means ± SEM. Analyzed by two-tailed Student's t test.

