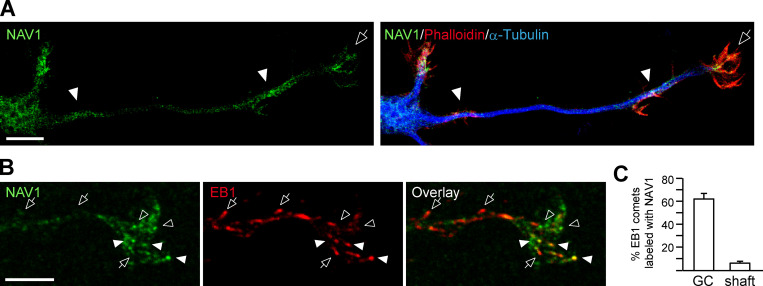
Figure S1.
NAV1 accumulates in F-actin–rich areas in cortical neurons and colocalizes with EB1 at MT plus ends in the GC. Related to Fig. 1. (A and B) Confocal microscopy images of GCs of cortical neurons (2 DIV) stained with the indicated antibodies and phalloidin-TRITC. Results were replicated in multiple neuronsfrom two independent cultures. (A) The arrow points to an axonal GC enriched with F-actin and NAV1. Arrowheads mark areas along the axon shaft enriched with F-actin and NAV1. Scale bar, 10 µm. (B) Arrows mark EB3-postive/NAV1-negative MT plus ends. Closed arrowheads mark EB3/NAV1-positive MT plus ends. Open arrowheads mark EB3-negative NAV1 granules. Scale bar, 5 µm. (C) Percentage of EB1 comets colabeled with NAV1 in GCs and 10 µm upstream in their axon shafts from B. n = 214 EB1 comets in 17 GCs from two independent experiments. Histogram shows means ± SEM.

