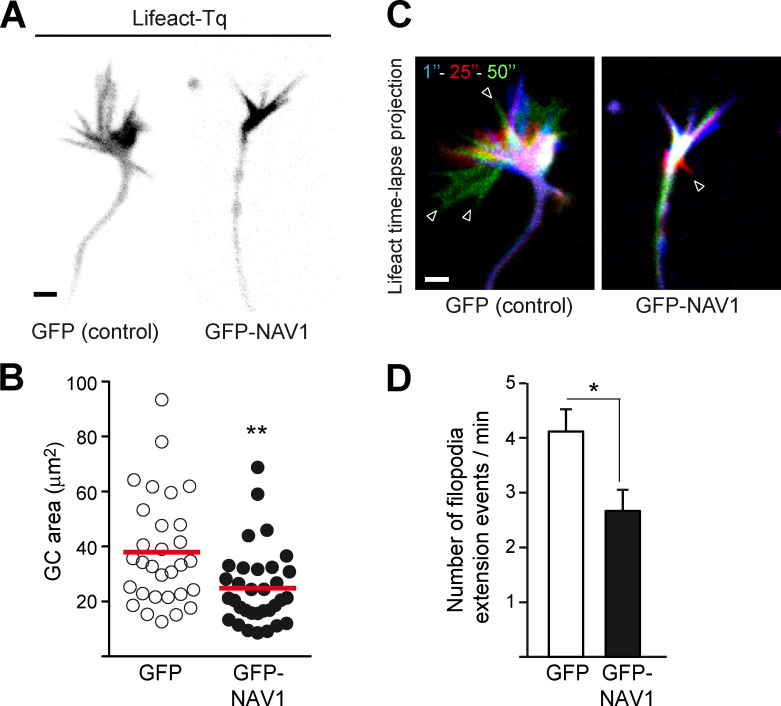
Figure S2.
Overexpression of NAV1 compacts the GC and inhibits its dynamics. Related to Fig. 1. Axonal GCs of cortical neurons (2 DIV) transfected with Lifeact-Tq and GFP or GFP-NAV1, and imaged by time-lapse microscopy during 2 min. (A) Lifeact-Tq images of GCs of control and NAV1-overexpressing neurons. Scale bar, 2 µm. (B) Quantification of GC area. (C) Color-coded time-lapse projections of the Lifeact-Tq signal. The indicated time points were used. Arrowheads mark filopodia. Scale bar, 2 µm; time, seconds. (D) GC dynamics in control and NAV1-overexpressing neurons. n = 30 (GFP) and 33 (GFP-NAV1) GCs from three independent experiments. Dot plot shows means. Histogram shows means ± SEM. Analyzed by two-tailed Student's t test.

