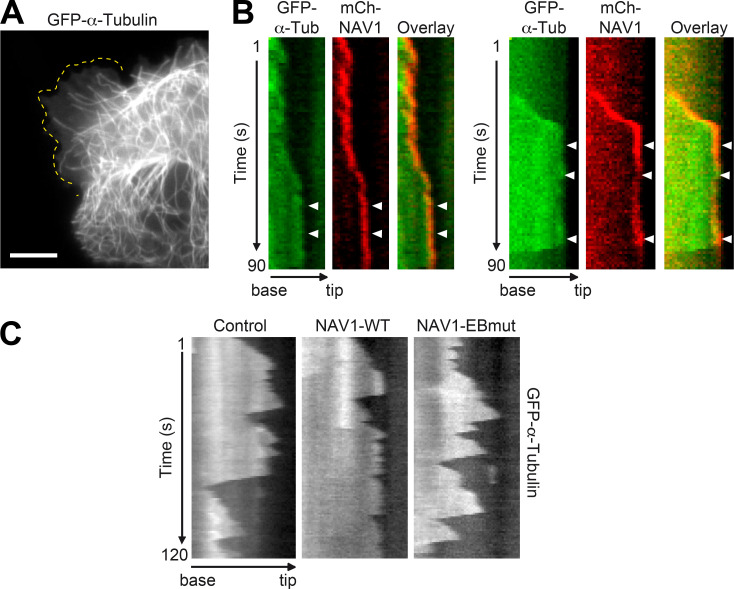
Figure S5.
Kymograph-based analysis of MT dynamics in LLCPK-1α cells stably expressing GFP-α-tubulin and transfected with mCherry-NAV1. Related to Table 1. (A) Representative TIRF microscopy image of an LLCPK-1α cell showing GFP-labeled MTs exploring a lamellipodium (dashed line). Scale bar, 10 µm. (B) Representative kymographs obtained from time-lapse microscopy of MT plus ends in LLCPK-1α cells stably expressing GFP-α-tubulin and transfected with mCherry-NAV1, illustrating the persistence of mCherry-NAV1 at the tip of paused MTs. Arrowheads point to pausing phases of the MT dynamics. See also Video 6. (C) Representative kymographs depicting the dynamics of MTs in cells transfected with either mCherry (control), mCherry-NAV1-WT, or mCherry-EBmut and imaged by TIRF time-lapse microscopy for 2 min. The ectopic expression of NAV1-WT induces longer periods of pause and shorter catastrophe events resulting from more frequent transitions from shrinkage to pause and less frequent transitions from pause to shrinkage (see Table 1).

