Figure S1.
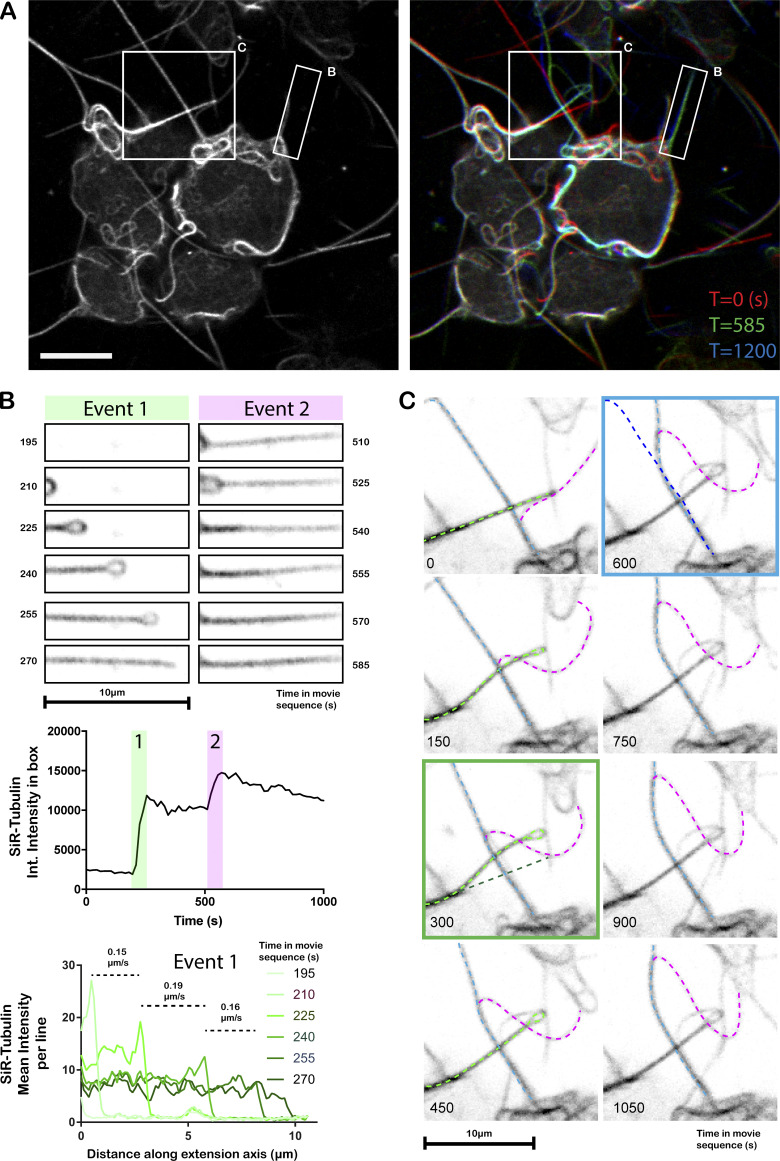
Live-cell confocal imaging of microtubule projection formation through loop-extrusion in SiR-tubulin–labeled HAP1 cells. (A) Left image shows cells at T = 0 s. Right image shows T = 0, T = 585, and T = 1,200 (time in s) in red, green, and blue channels, respectively. Boxes highlight areas that are expanded and analyzed in B and C. Scale bar, 10 µm. (B) Stills from the image series describing the formation and reinforcement of a microtubule-based projection through the extension/resolution of a loop. Green panels show extension of the first loop (event 1). Top graphs show change in tubulin integrated (Int.) intensity over the whole region as a function of time. The lower graph shows the average tubulin intensity per line as a function of distance along the axis of projection extension (x axis) and rate of extension. Magenta panels (event 2) show addition of further tubulin intensity over a similar time period later in the video, indicating that the projections are formed by the progressive layering of microtubules from the extrusion of loops. (C) Complex interactions between projections that affect their organization. Three extensions are highlighted by light blue, light green, and magenta dotted lines. The magenta projection moves along the light blue projection. The position of the light green filament is shifted as it passes. Green box panel shows original (dark green) and new positions (light green) of the projection. As the magenta proceeds along the blue filament, the blue projection is bent. Blue boxed panel shows original (dark blue) and new positions (light blue) of the blue projection.

