Figure 1.
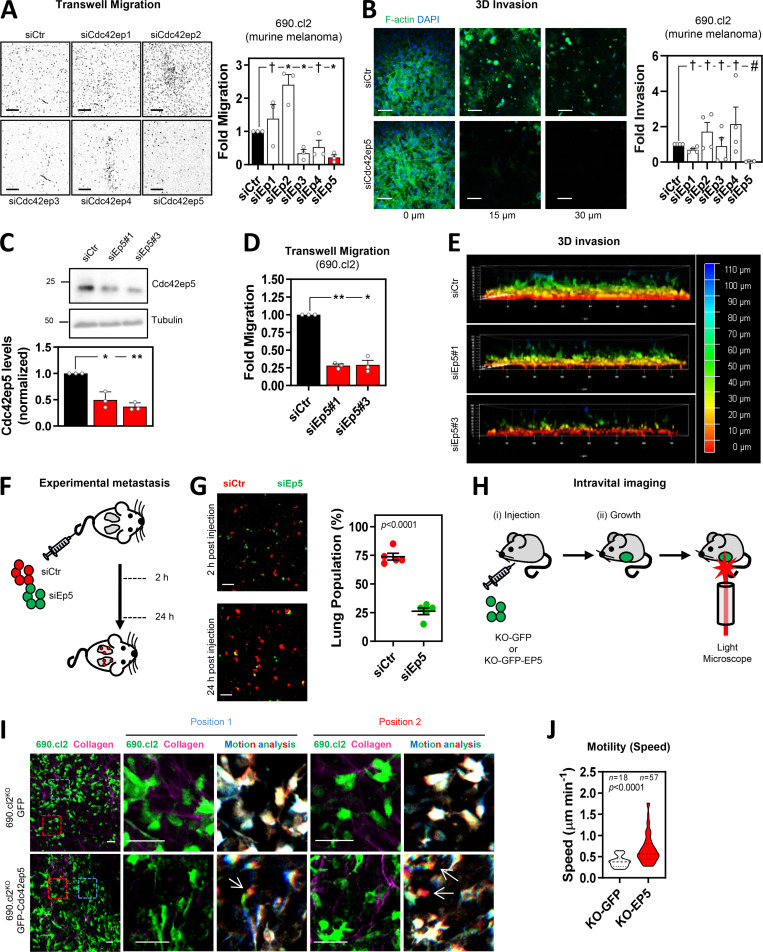
Directed siRNA screen identifies CDC42EP5 as a new regulator of melanoma migration and invasion. (A) Images show DAPI staining of migrated 690.cl2 murine melanoma after transfection with control (siCtr) or Cdc42ep1-5 (siEp1-5) siRNA. Scale bars, 1 mm. Graph shows fold migration. Bars indicate mean ± SEM (n = 3 independent experiments; one-way paired ANOVA, Dunnett’s test: †, not significant; *, P < 0.05). (B) Images show F-actin (green) and DAPI (blue) staining of 690.cl2 cells at different levels of collagen invasion after transfection with indicated siRNAs. Scale bars, 100 µm. Graph shows fold invasion. Bars indicate mean ± SEM (n = 3 independent experiments; one-way paired ANOVA, Dunnett’s test: †, not significant; #, P < 0.0001). (C) Representative Western blot showing indicated protein levels in 690.cl2 cells after transfection with control (siCtr) or two individual Cdc42ep5 (siEp5) siRNAs. Graph shows quantification of Cdc42ep5 protein levels. Bars indicate mean ± SEM (n = 3 experiments; one-way paired ANOVA, Dunnett’s test; *, P < 0.05; **, P < 0.01). (D) Fold migration of 690.cl2 cells after transfection with indicated siRNAs. Bars indicate mean ± SEM (n = 3 independent experiments; one-way paired ANOVA, Dunnett’s test: *, P < 0.05; **, P < 0.01). (E) Images show 3D reconstructions of collagen invasion assays of 690.cl2 cells transfected with indicated siRNAs. Color scale bar indicates depth of invasion. (F) Experimental metastasis approach. Equal numbers of control (siCtr, red) and Cdc42ep5-knockdown (siEp5, green) 690.cl2 cells were injected in the tail vein of mice. 2 and 24 h after injection, lungs were analyzed by microscopy. (G) Images of mouse lungs at 2 and 24 h after tail injection with 690.cl2 cells as in F. Scale bars, 100 µm. Graph shows proportions (%) of siCtr and siEp5 cells in lungs at 24 h. Lines represent mean ± SEM (n = 5 experiments; unpaired t test). (H) Intravital imaging approach. 690.cl2KO-GFP or 690.cl2KO-GFP-Cdc42ep5 cells were injected subcutaneously in mice. Grown living tumors on anaesthetized mice were then exposed and imaged using two-photon microscopy. (I) Intravital imaging of 690.cl2KO-GFP or 690.cl2KO-GFP-Cdc42ep5 tumors (green, melanoma cells; magenta, collagen fibers). Right panels show motion analysis images from different time points where static cells appear white; arrows indicate fast-moving cells represented as a trail of blue-green-red pseudocolors. Scale bars, 50 µm. (J) Violin plot showing individual speed of moving cells from I. n, moving cells in five mice per condition; Mann–Whitney test. KO, knockout.

