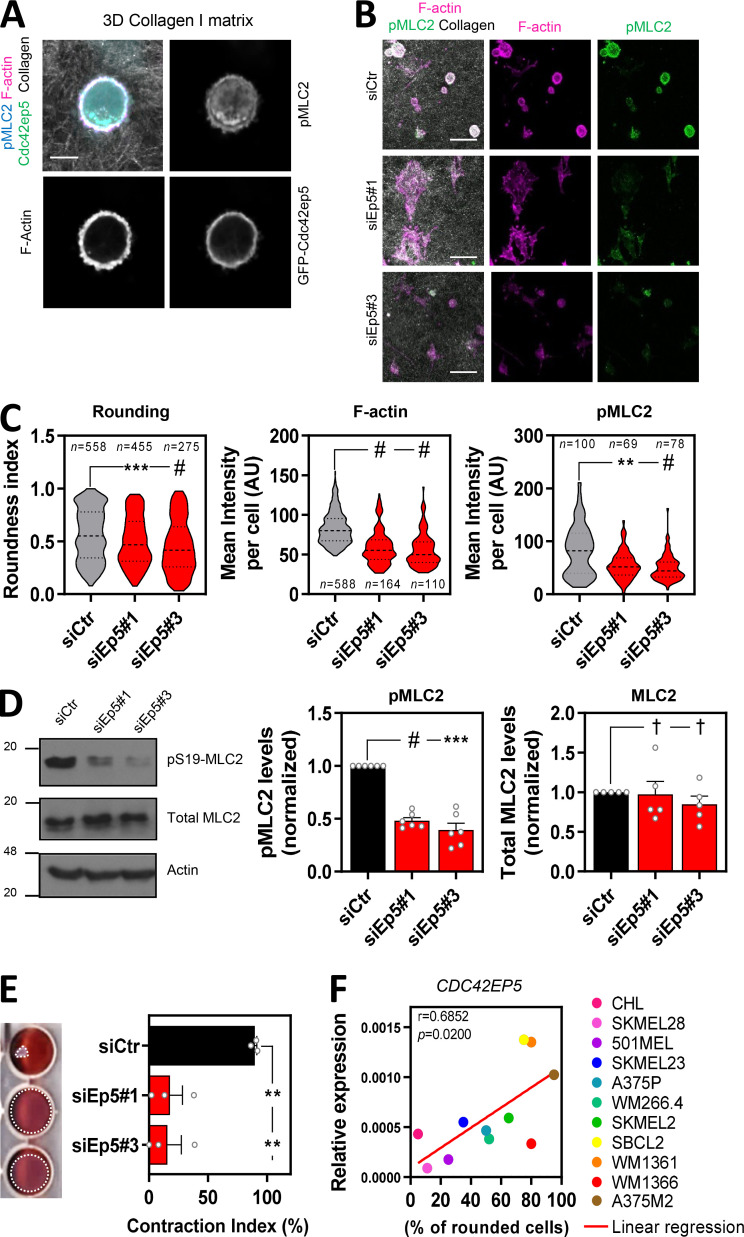
Figure 2.
CDC42EP5 modulates actomyosin function in melanoma in 3D. (A) Image of a 690.cl2 cell on collagen-rich matrix expressing GFP-Cdc42ep5 (green) and stained for F-actin (magenta) and pS19-MLC2 (cyan); collagen fibers (gray) were captured by reflectance signal. Individual grayscale channels are also shown. Scale bar, 10 µm. (B) Images of 690.cl2 cells on collagen-rich matrices after transfection with control (siCtr) or two individual Cdc42ep5 (siEp5) siRNAs. Images show staining for F-actin (magenta) and pS19-MLC2 (green); collagen fibers (gray) were captured by reflectance signal. Scale bars, 40 µm. (C) Violin plots showing roundness index (left), F-actin mean intensity (middle), and pS19-MLC2 mean intensity (right) of individual cells from B. n represents individual cells; Kruskal–Wallis and Dunn's tests: **, P < 0.01; ***, P < 0.001; #, P < 0.0001. (D) Western blots showing indicated protein levels in 690.cl2 cells after transfection with control (siCtr) and two individual Cdc42ep5 (siEp5) siRNAs. Graphs show quantification of normalized pS19-MLC2 and total MLC2 levels. Bars indicate mean ± SEM (n = 6 [pMLC2] and 5 [MLC2] independent experiments; one-way paired ANOVA, Dunnett’s test: †, not significant; ***, P < 0.001; #, P < 0.0001). (E) Images and graph showing gel contraction of 690.cl2 cells after indicated treatments. Bars indicate mean ± SEM (n = 3 independent experiments; one-way paired ANOVA, Dunnett’s test: **, P < 0.01). (F) Graph shows expression of CDC42EP5 mRNA normalized to GAPDH expression in human melanoma cell lines with increasing rounding coefficients. Pearson’s correlation coefficient (r), statistical significance (p), and linear regression (red line) are shown. Each point in the graph represents the mean value of three independent experiments.

