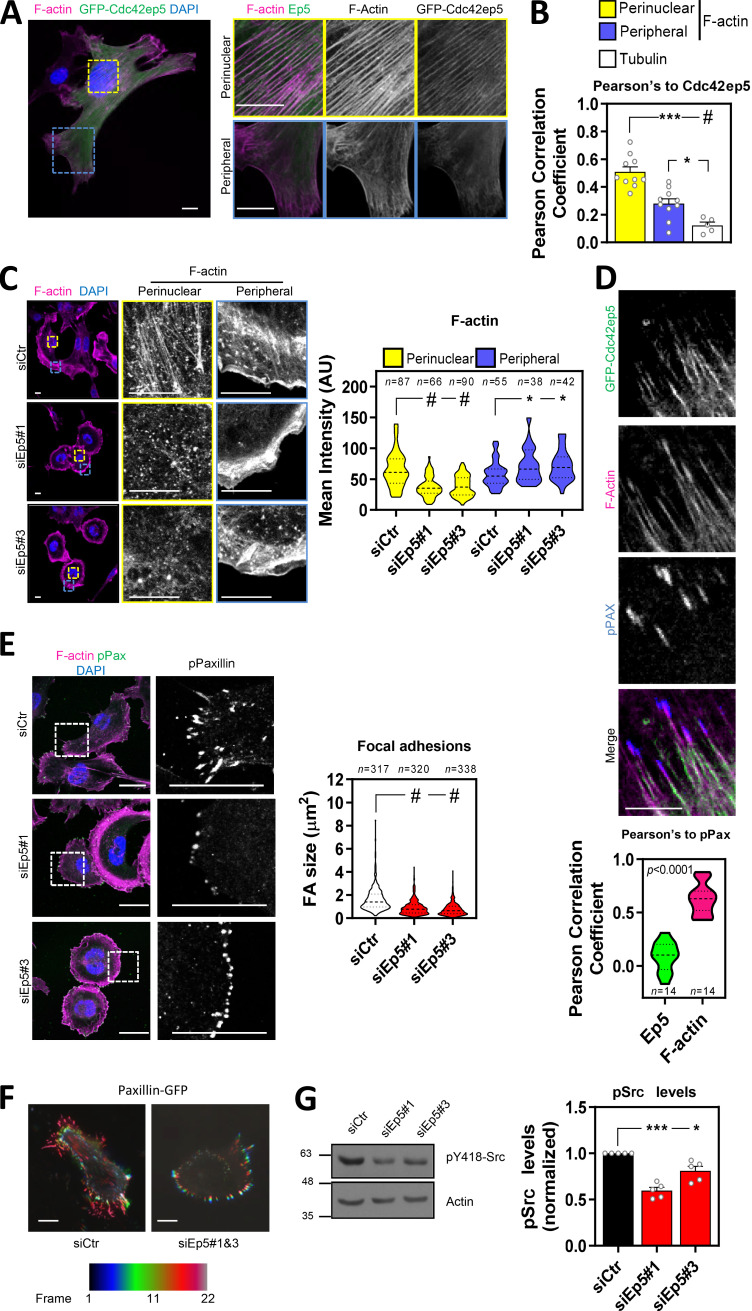
Figure 3.
Cdc42ep5 promotes stress fiber formation and FA maturation in 2D. (A) Image shows a 690.cl2 cell expressing GFP-Cdc42ep5 (green) on glass and stained for F-actin (magenta) and DAPI (blue). Additional panels show magnifications of perinuclear and peripheral areas. Scale bars, 12.5 µm. (B) Graph shows Pearson’s correlation coefficient of GFP-Cdc42ep5 signal against perinuclear and peripheral F-actin staining and tubulin staining. Bars indicate mean ± SEM (n = 10 independent cells [perinuclear and peripheral F-actin] and 5 [tubulin]; one-way paired ANOVA, Dunnett’s test: *, P < 0.05; ***, P < 0.001; #, P < 0.0001). (C) Images of 690.cl2 cells after transfection with control (siCtr) and two individual Cdc42ep5 (siEp5) siRNAs on glass. Images show F-actin (magenta) and DAPI (blue) staining with zoom-up panels showing perinuclear and peripheral regions. Scale bars, 12.5 µm. Graph is a violin-plot quantification of F-actin intensity in the perinuclear and peripheral regions in the indicated points. n, specific regions in individual cells; Kruskal–Wallis and Dunn's tests: *, P < 0.05; #, P < 0.0001. (D) Images show individual and merged channels of 690.cl2 cells expressing GFP-Cdc42ep5 (green) on glass and stained for F-actin (magenta) and pY118-Paxillin (blue). Scale bar, 5 µm. Graph at the bottom is a violin plot showing the Pearson’s correlation coefficient of Cdc42ep5 and F-actin staining against pY118-Paxillin–positive areas. (n, pY118-Paxillin–positive areas in individual cells; unpaired t test.) (E) Images of 690.cl2 cells on glass. Images show F-actin (magenta), pY118-Paxillin (green), and DAPI (blue) staining. Single-channel magnification of pY118-Paxillin staining is also shown. Scale bars, 25 µm. Graph is a violin plot showing quantification of FA size (i.e., pY118-Paxillin–positive area). n, peripheral regions in individual cells; Kruskal–Wallis and Dunn's: #, P < 0.0001. (F) Images show motion analysis of Paxillin-GFP after TIRF imaging. Scale bars, 25 µm. (G) Western blots showing indicated protein levels in 690.cl2 cells after transfection with control (siCtr) and two individual Cdc42ep5 (siEp5) siRNAs. Right graphs show quantification of normalized p418-Src levels. Bars indicate mean ± SEM (n = 5 independent experiments; one-way paired ANOVA, Dunnett’s test: *, P < 0.05; ***, P < 0.001).

