Figure 4.
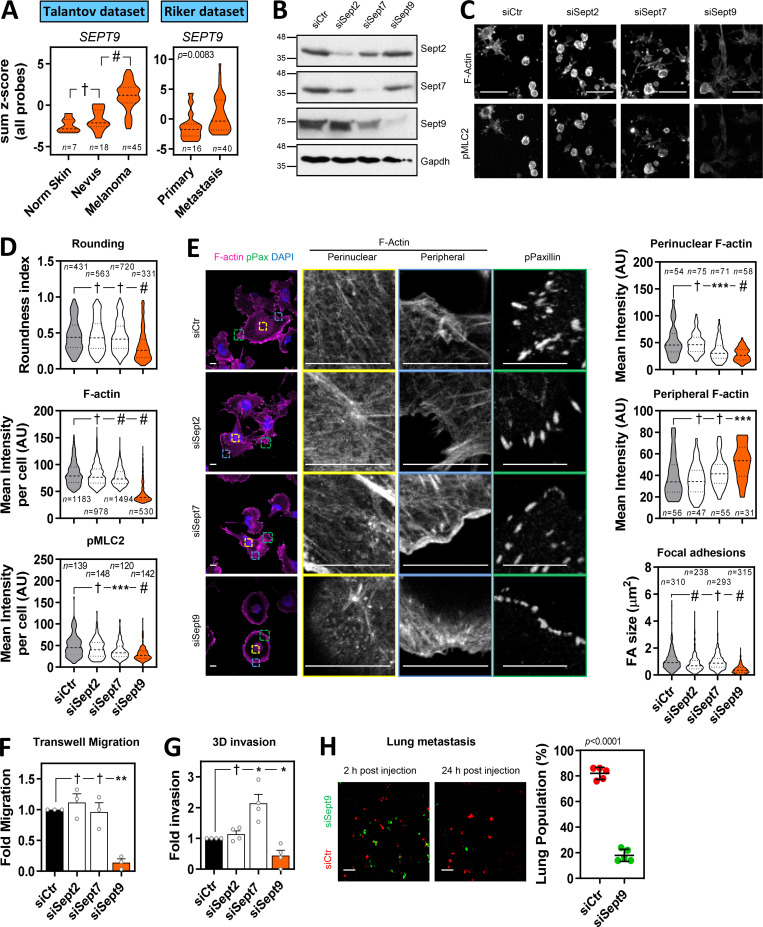
SEPT9 is required for actomyosin contractility and invasion in melanoma. (A) Violin plots show SEPT9 expression in human tissues from normal (Norm) skin, nevus, and melanoma (left: Talantov et al. dataset, GSE3189) and primary melanoma and metastatic melanoma (right: Riker et al. dataset, GSE7553). n, individual patients; Kruskal–Wallis and Dunn's tests [Talantov] and Mann–Whitney test [Riker]: †, not significant; #, P < 0.0001. (B) Western blots showing indicated protein levels in 690.cl2 cells after transfection with control (siCtr) and Sept2, Sept7, and Sept9 siRNA. (C) Images show F-actin and pS19-MLC2 staining of parental 690.cl2 after transfection with control (siCtr), Sept2, Sept7, and Sept9 siRNA on collagen-rich matrices. Scale bars, 75 µm. (D) Violin plots showing roundness index (top), F-actin mean intensity (center), and pS19-MLC2 mean intensity (bottom) of individual cells from C. n, individual cells; Kruskal–Wallis and Dunn's tests: †, not significant; ***, P < 0.001; #, P < 0.0001. (E) Images show F-actin (magenta), pY118-Paxillin (green), and DAPI (cyan) staining in 690.cl2 cells after transfection with indicated siRNAs on glass. Right panels show indicated magnifications of F-actin staining in the perinuclear and peripheral regions, and pY118-Paxillin staining at the cell border. Scale bars, 12.5 µm. Violin plots show quantification of F-actin intensity in the perinuclear (top) and peripheral (center) regions, and quantification of FA size (bottom). n, single regions from individual cells [top and center] and individual FAs [bottom]; Kruskal–Wallis and Dunn's tests: †, not significant; ***, P < 0.001; #, P < 0.0001. (F and G) Graphs show fold migration ability (F) and fold invasion into collagen (G) of 690.cl2 cells after transfection with indicated siRNAs. Bars indicate mean ± SEM (n = 3 [F] and 4 [G] independent experiments; paired t tests: †, not significant; *, P < 0.05; **, P < 0.01). (H) Images of mouse lungs at 2 and 24 h after tail injection with 690.cl2 cells transfected with control (siCtr-Red) or Sept9 (siSept9-Green) siRNA. Scale bars, 100 µm. Graph shows proportions (%) of siCtr and siSept9 cells within the lungs at 24 h. Lines represent mean ± SEM (n = 5 mice; unpaired t test). AU, arbitrary units.

