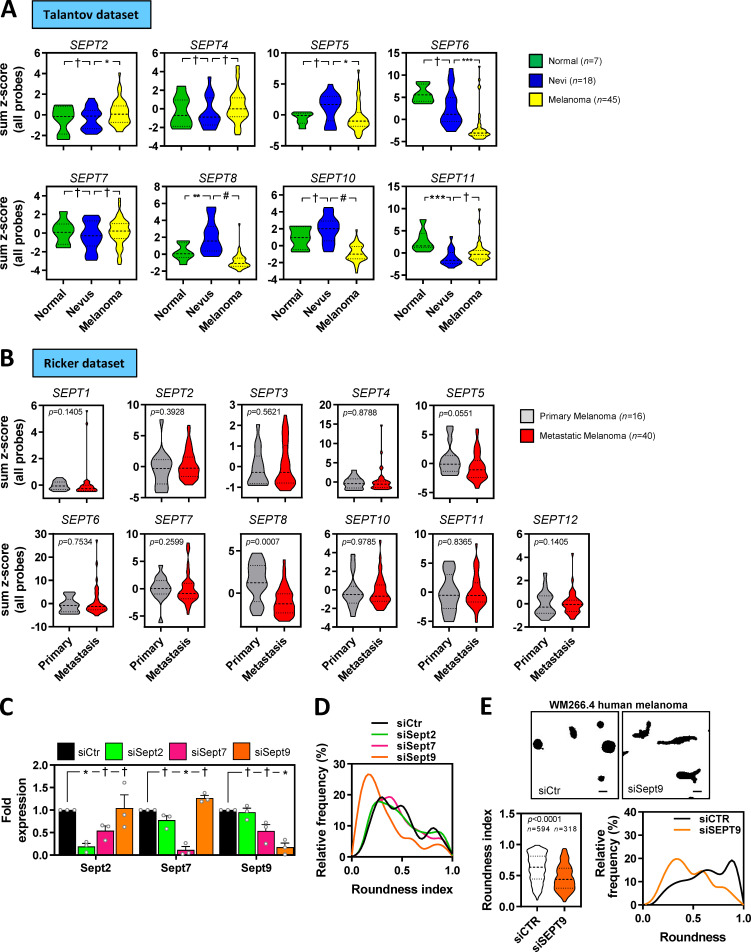
Figure S4.
SEPT9 is associated with melanoma aggressiveness. (A and B) Violin plots showing the expression of available septin genes in human tissues from normal skin, nevus, and melanoma from the Talantov et al. dataset (GSE3189; A) and primary melanoma and metastatic melanoma from the Riker et al. dataset (GSE7553; B). n, individual patients; Kruskal–Wallis and Dunn's tests (A) and Mann–Whitney tests (B): †, not significant; *, P < 0.05; **, P < 0.01; ***, P < 0.001; #, P < 0.0001. (C) Graph showing quantification of normalized protein expression levels of Sept2, Sept7, and Sept9 in 690.cl2 cells after transfection with control (siCtr) or Sept2, Sept7, or Sept9 siRNAs. Bars indicate mean ± SEM (n = 3 experiments; two-way ANOVA Dunnett’s test: †, not significant; *, P < 0.05). Representative Western blot is shown in Fig. 4 B. (D) Graph shows the relative frequencies of roundness indexes in 690.cl2 cells after transfection with control (siCtr) or Sept2, Sept7, or Sept9 siRNA on collagen-rich matrices (additional representation of Fig. 4 D). (E) Top panels show morphologies of WM266.4 after transfection with control (siCtr) or SEPT9 (siSEPT9) siRNA on top of collagen-rich matrices. Scale bars, 20 µm. Left bottom graph shows roundness index quantification of individual cells (n indicates individual cells; Mann–Whitney test). Right bottom graph shows the relative frequencies of roundness indexes.

