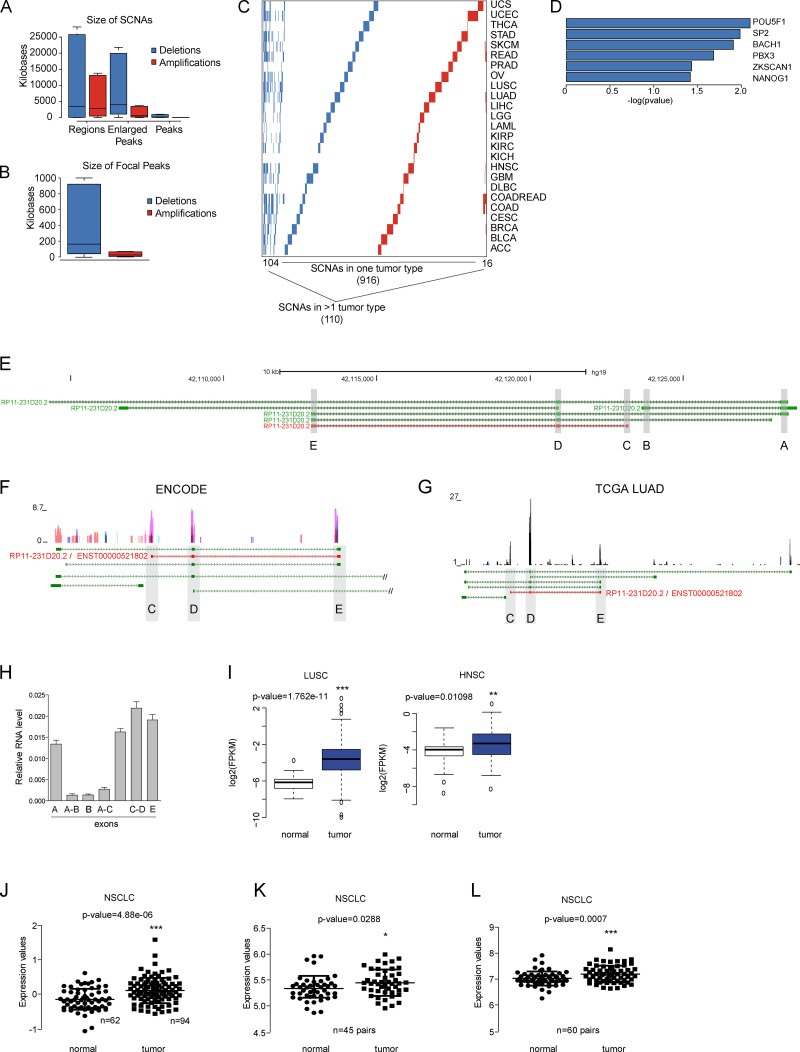
Figure S1.
Cancer-associated somatic copy number alterations (SCNAs) analysis. (A) Size ranges of genomic deletions and amplifications at three levels: regions, enlarged peaks, and peaks. (B) Size range of the focal peaks reported by the GISTIC algorithm, defined as the part of the copy number alteration with the greatest amplitude and frequency. (C) Recurrence of the SCNAs identified, where rows represent SCNAs and columns represent tumor types. (D) Transcription factors with binding significantly enriched around the TSS of deleted lncRNAs. (A–C) Color code: deletions are shown in blue and amplifications in red. (E) Representation of the six different isoforms annotated in the ALAL-1 locus with their Ensembl Transcript IDs. Isoforms are represented in the 5′ to 3′ direction, and exons are shadowed in gray and identified with letters (A–E). The ALAL-1 predominant form (RP11-231D20.2) is highlighted in red. (F) RNA-seq track showing the expression of ALAL-1 in nine cell lines from the ENCODE project. (G) RNA-seq data from the TCGA-LUAD sample TCGA-44-7661-01A with a mean expression of ALAL-1, supporting the expression of ENST00000521802 (shown in red). (H) Relative expression of ALAL-1 quantified by qRT-PCR with several sets of primers mapping to different exons. Error bars represent SEM. (I) Expression of ALAL-1 in LUSC (n = 398, T; n = 44, N) and in head and neck squamous carcinoma (HNSC, n = 297, T; n = 37, N) tumors and normal samples. (J–L) ALAL-1 expression quantified by microarray analysis (probe 231378_at) of cohort GSE19188, including 62 adjacent normal lung tissues and 94 NSCLC tumors (G); cohort GSE18842 with 45 paired samples (normal/tumor) of NSCLC (H); and cohort GSE19804, including 60 paired samples (normal/tumor) from nonsmoking female cancer patients (I–L). Statistical significance was determined by two-tailed unpaired t test with Welch’s correction and represented as *, P ≤ 0.05; **, P ≤ 0.01; ***, P ≤ 0.001. In A, B, and I, bottom and top of the box are the 25th and 75th percentile (the lower Q1 and upper quartile Q3), and the band near the middle of the box corresponds to the median. The lower whisker extends Q1 – 1.5 * interquartile range (IQR) and the upper one Q3 + 1.5 IQR. In F and G, green track represents the different isoforms of ALAL-1 annotated in Gencode v19. In J–L, the lines represent the median and the 25th and 75th percentile (the lower Q1 and upper quartile Q3). UCS, uterine carcinosarcoma; UCEC, uterine corpus endometrial carcinoma; THCA, thyroid carcinoma; STAD, stomach adenocarcinoma; SKCM, skin cutaneous melanoma; READ, rectum adenocarcinoma; PRAD, prostate adenocarcinoma; OV, ovarian serous cystadenocarcinoma; LIHC, liver hepatocellular carcinoma; LGG, brain lower grade glioma; LAML, acute myeloid leukemia; KIRP, kidney renal papillary cell carcinoma; KIRC, kidney renal clear cell carcinoma; GBM, glioblastoma multiforme; DLBC, lymphoid neoplasm diffuse large B-cell lymphoma; COADREAD, colon adenocarcinoma; COAD, colon adenocarcinoma; CESC, cervical squamous cell carcinoma and endocervical adenocarcinoma; BRCA, breast invasive carcinoma; BLCA, bladder urothelial carcinoma; ACC, adrenocortical carcinoma; T, tumor; N, normal; FPKM, fragments per kilobase of transcript per million mapped reads.

