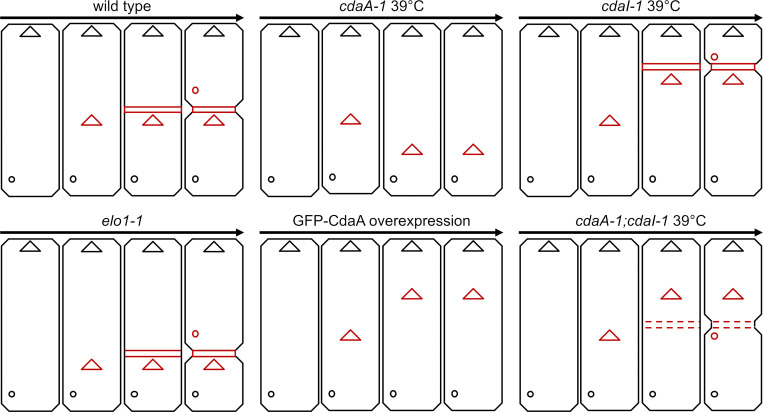
Figure 10.
A graphical summary of the cortical phenotypes of mutants analyzed. The positions of three new structures are shown in red: oral primordium (triangles), cortical subdivision (dashed or continuous horizontal bars), and new CVPs (circles). The parental oral apparatus and CVPs are shown in black. The arrows indicate the progression of time. Note that in the case of the single cdaA-1 mutant cells, we did not show the increase in the total size of these cells that is primarily caused by expansion of the area anterior to the oral primordium (see Table S1).

