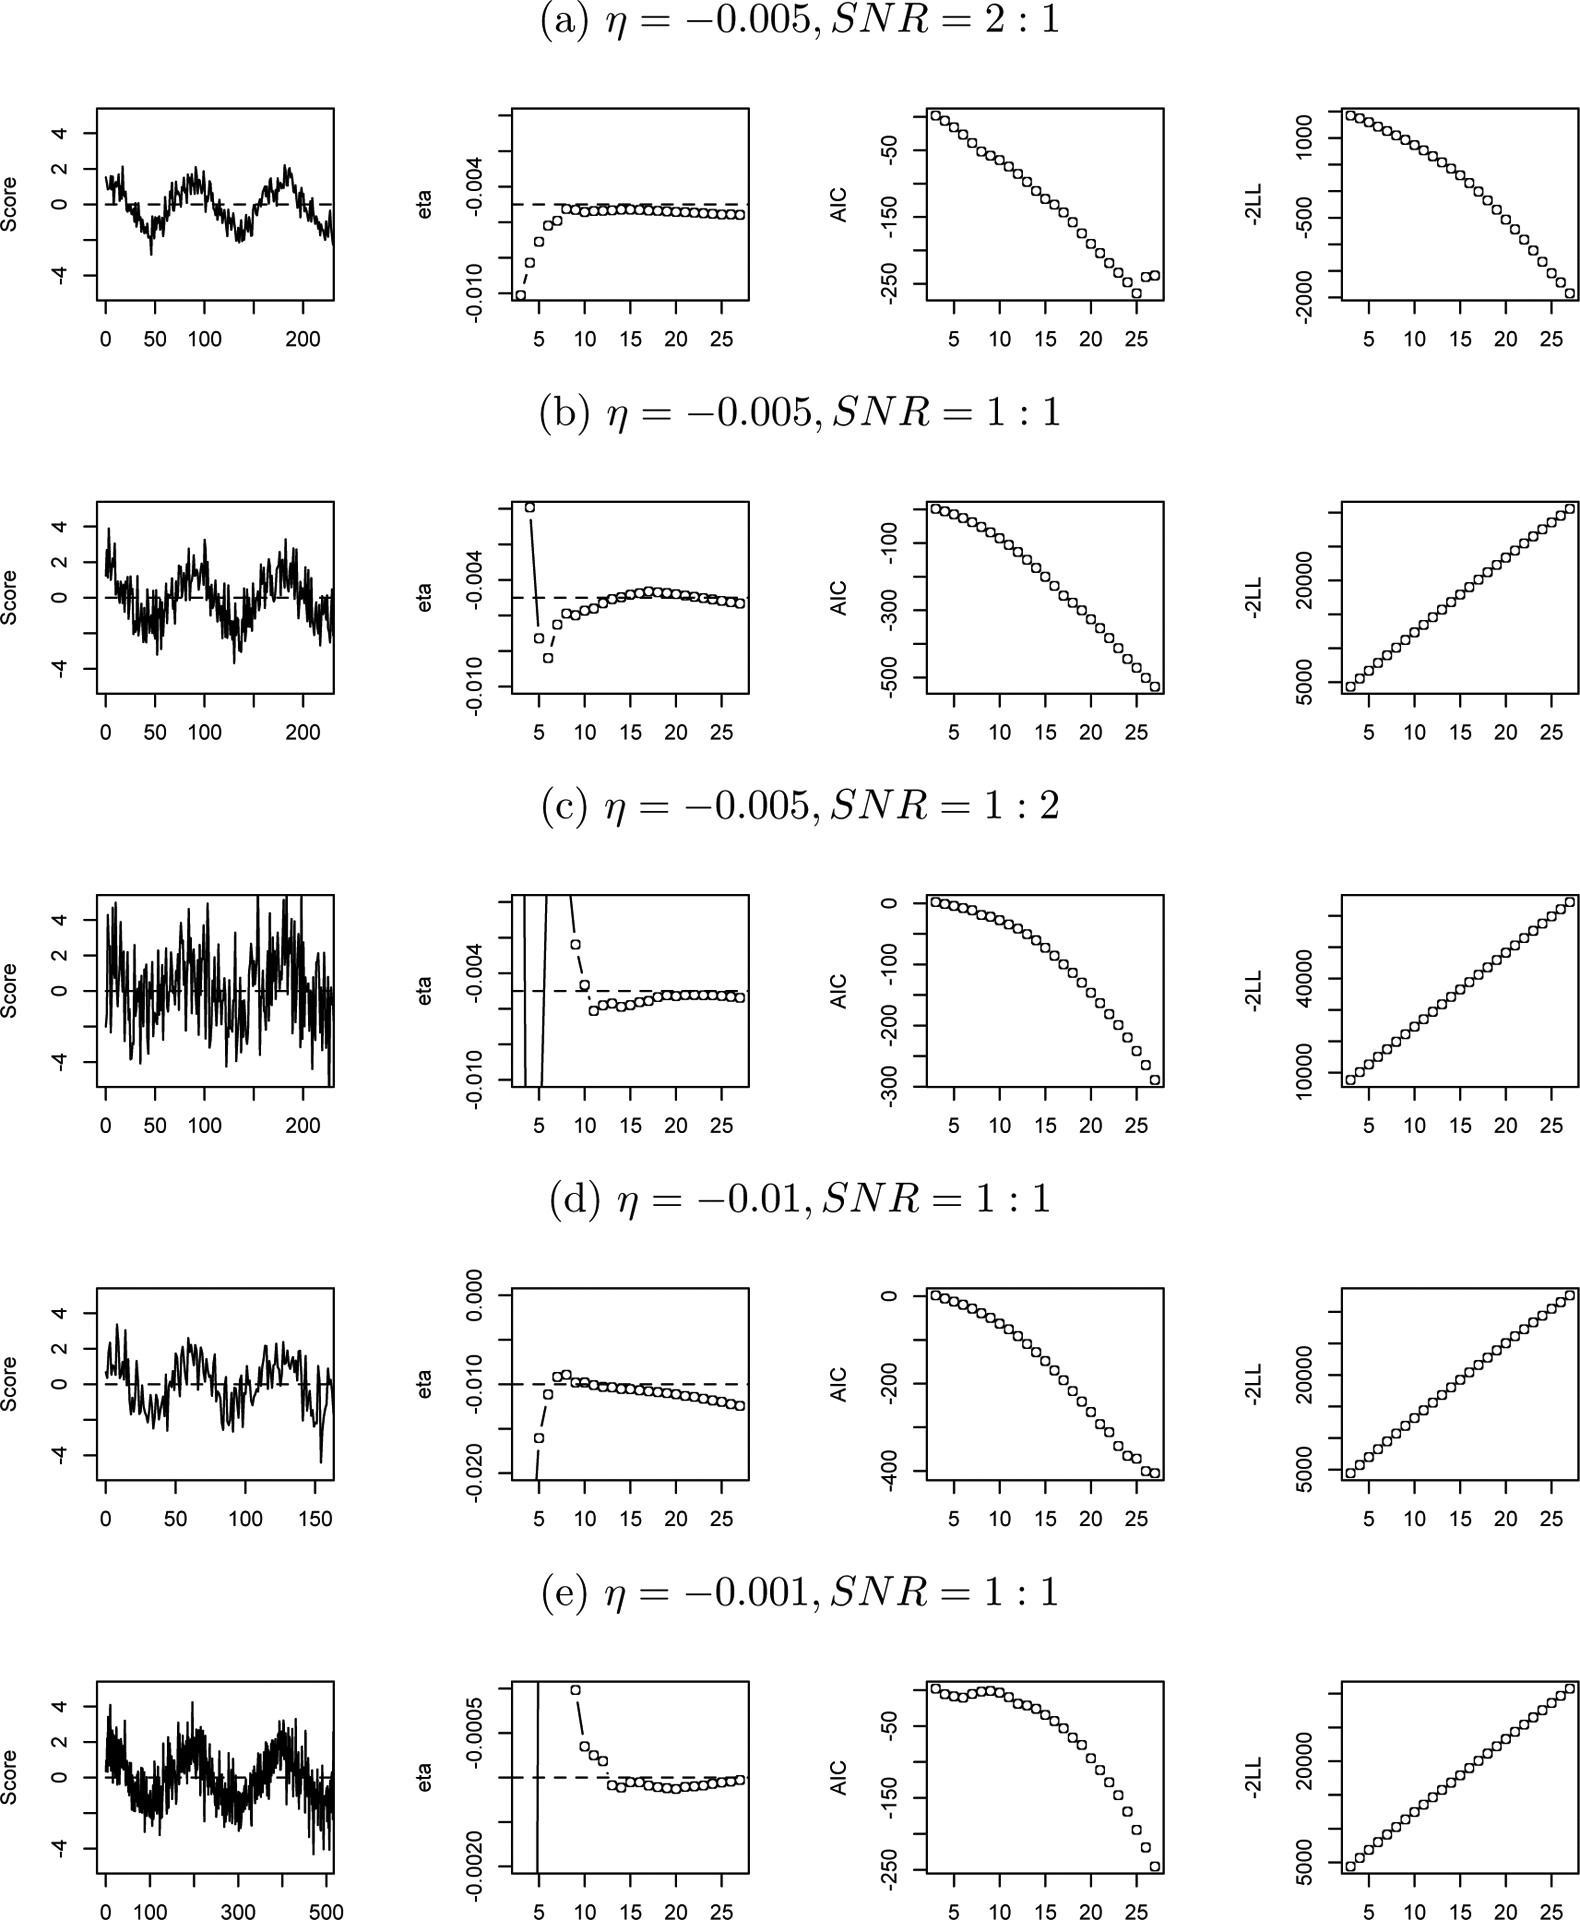
Figure 4.

Relationship between D and Estimated η, AIC and −2LL.
Note: In each condition (a, b, c, d, e), from left to right, the first plot presents the simulated time series, in which the horizontal axis stands for time and the horizontal dash line indicates the equilibrium; the second plot presents how the estimated η change with the time delay embedding dimension D, in which the horizontal dash line indicates the true value of η; the third plot presents model AIC against D; and the last plot presents −2LL against D.
