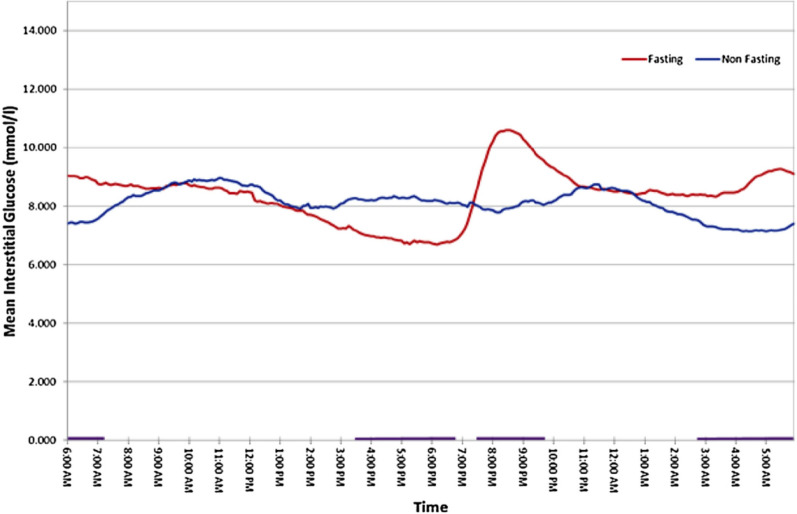
Fig. 4.
Mean 24-h continuous glucose monitoring (CGM) profiles derived from all patients with diabetes (n = 56) during Ramadan (Fasting) and non-Ramadan (Non-fasting) periods. The purple bars along the x-axis at the bottom of the graph depict periods when the difference between the two states is large and significant
*Reprinted from Diabetes Metab, Vol 41, Lessan et al, Glucose excursions and glycaemic control during Ramadan fasting in diabetic patients: Insights from continuous glucose monitoring (CGM), pp28–36, Copyright (2015), with permission from Elsevier [17]

