
Figure 3: EGCG affected the expression of apoptosis-related proteins.
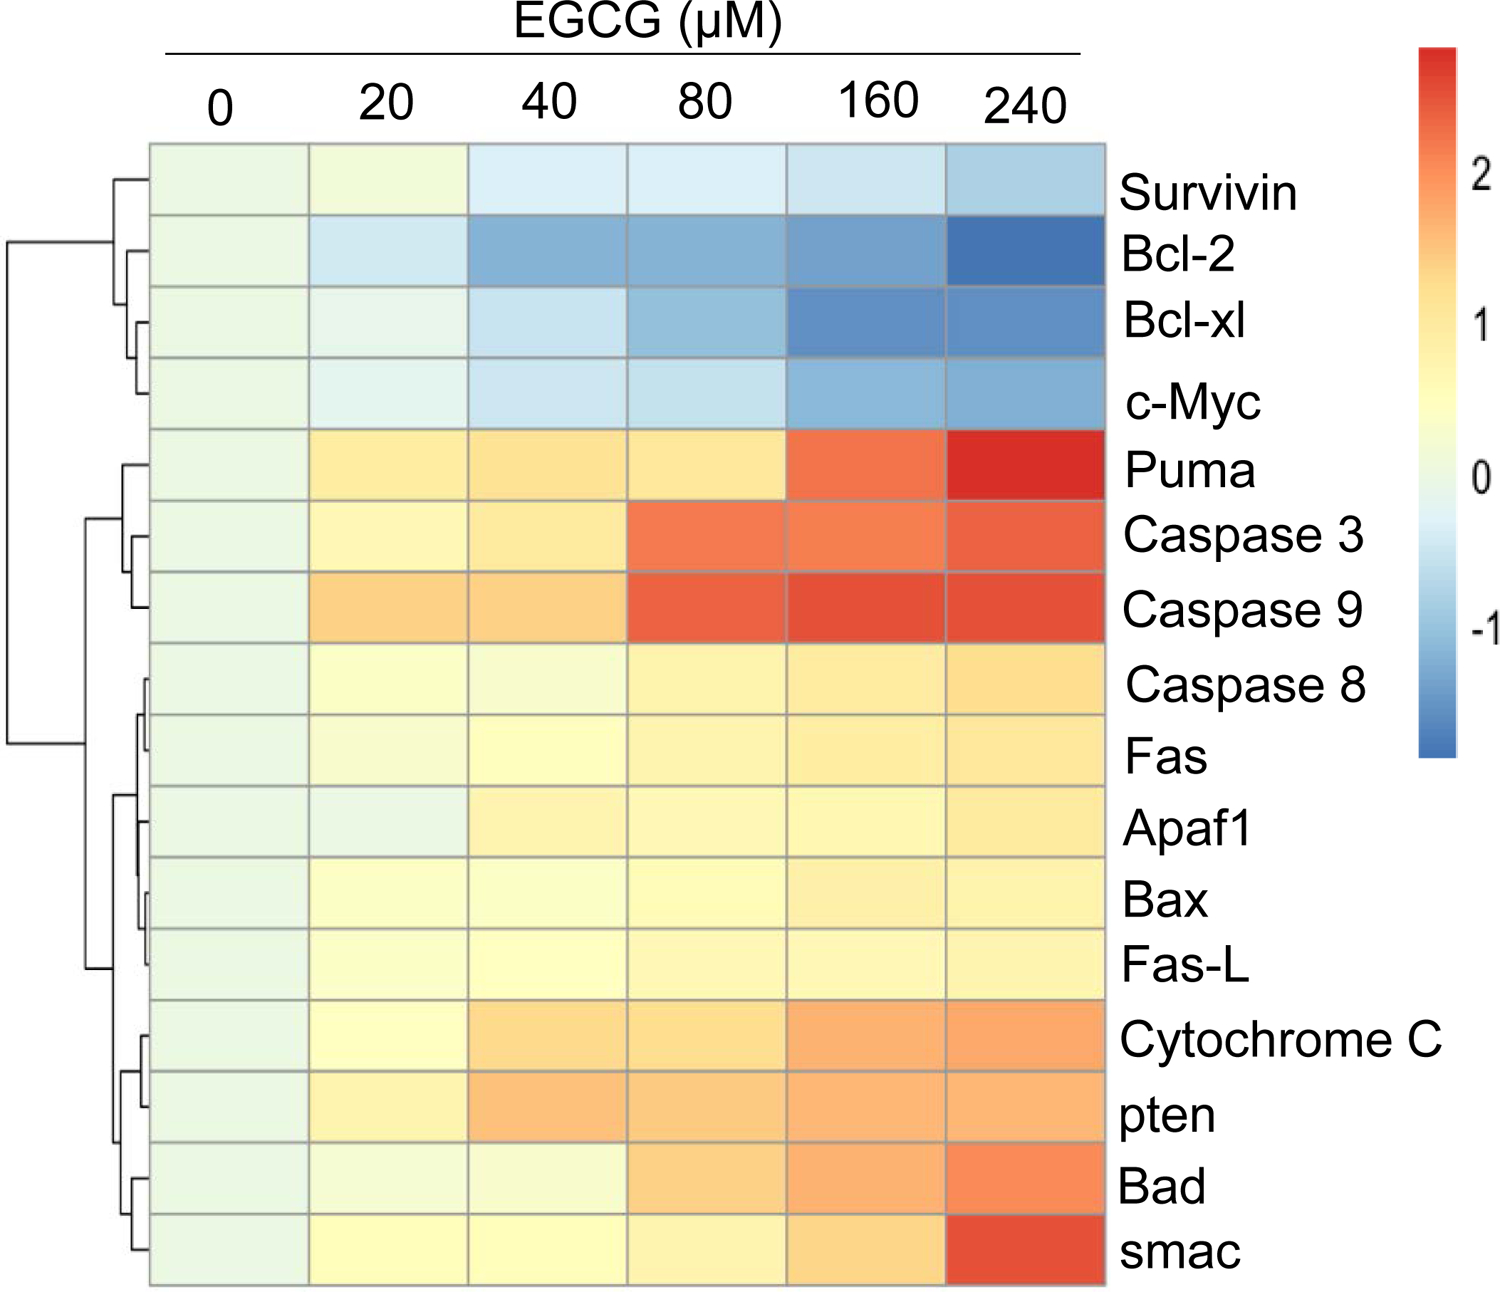
Microarray heat map of differentially expressed genes (as indicated) levels within control cells or cells treated with EGCG at various concentrations (20–240 μM) for 24 h. Heat map results are shown as the mean fold changes (log2) of the relative mRNA expression level for each protein (2−△△t).