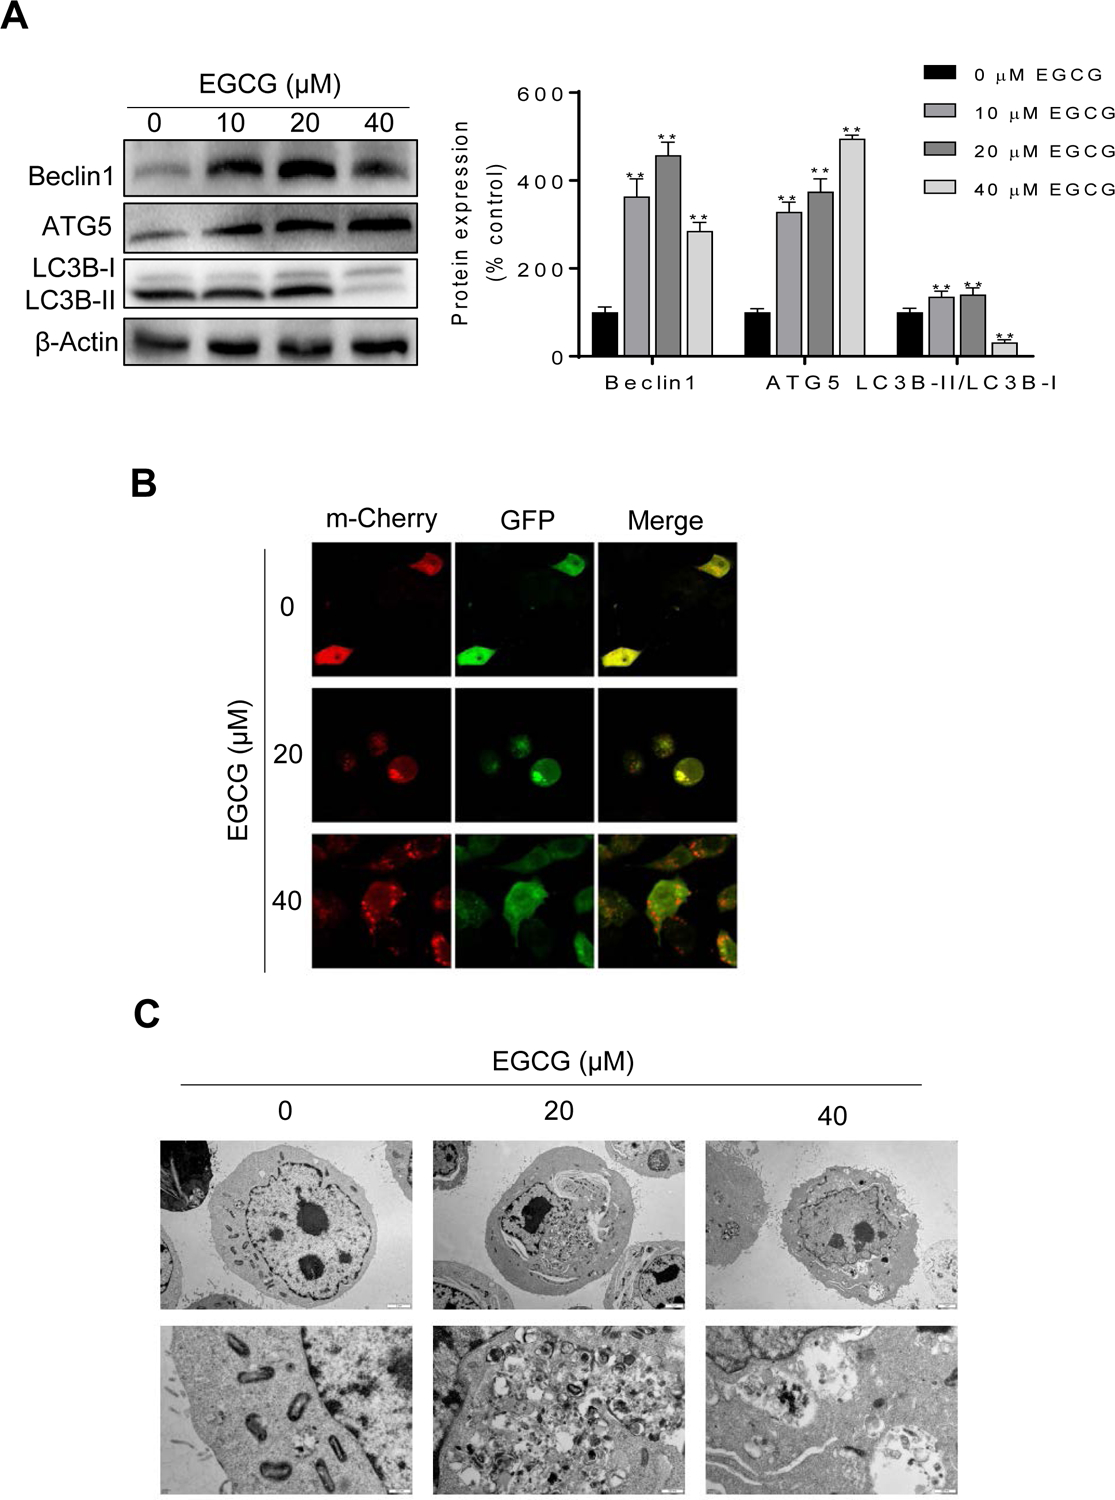
Figure 4: EGCG affected autophagy in 4T1 breast cancer cells.

A: 4T1 cells lysates were analyzed for Beclin1, ATG5 and LC3B by immunoblotting. Loading control: β-actin. Bands were quantified and results are expressed as percentage of control. (*p<0.05, **p<0.01 vs. control). B: Representative images (x400) of 4T1 cells treated with either vehicle (control) or EGCG and stained for mCherry-GFP-LC3B. C: Autophagosome formation was depicted using transmission electron microscope in 4T1 cells treated with or without EGCG for 24 h. Representative images (x8000, x30000) are shown.
