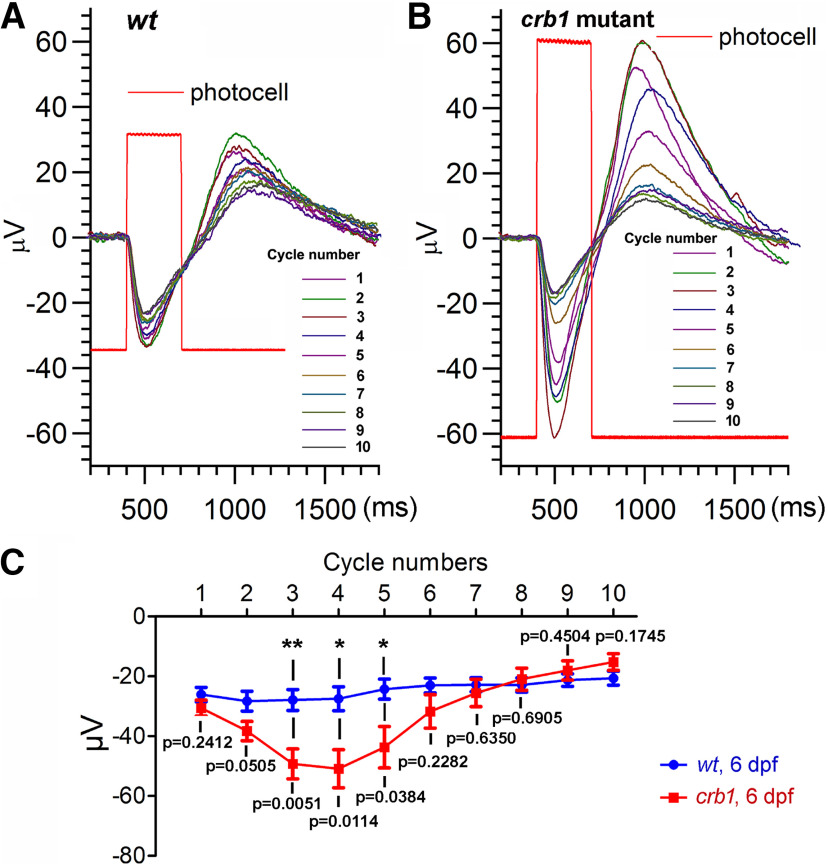
Figure 9.
The effects of the loss of Crb1 on the ERG of cones. A, B, Representative ERG measurements of cone light responses in WT (A) and crb1 mutant larvae (B) at 6 dpf. Lines 1-10 indicate the successive cycle numbers of white light stimulation. Rectangular steps (red) represent the duration of light exposure as monitored by a photocell in the light beam. C, The average changes in the amplitudes of vitreal negativity during light stimulation over time (N = 8 eyes for wt; N = 11 eyes for crb1). Data are mean ± SEM. Statistical differences between WT and crb1 mutant fish were evaluated for each cycle of light stimulation with Student's t test, two-tailed hypothesis: *p < 0.05; **p < 0.01.

