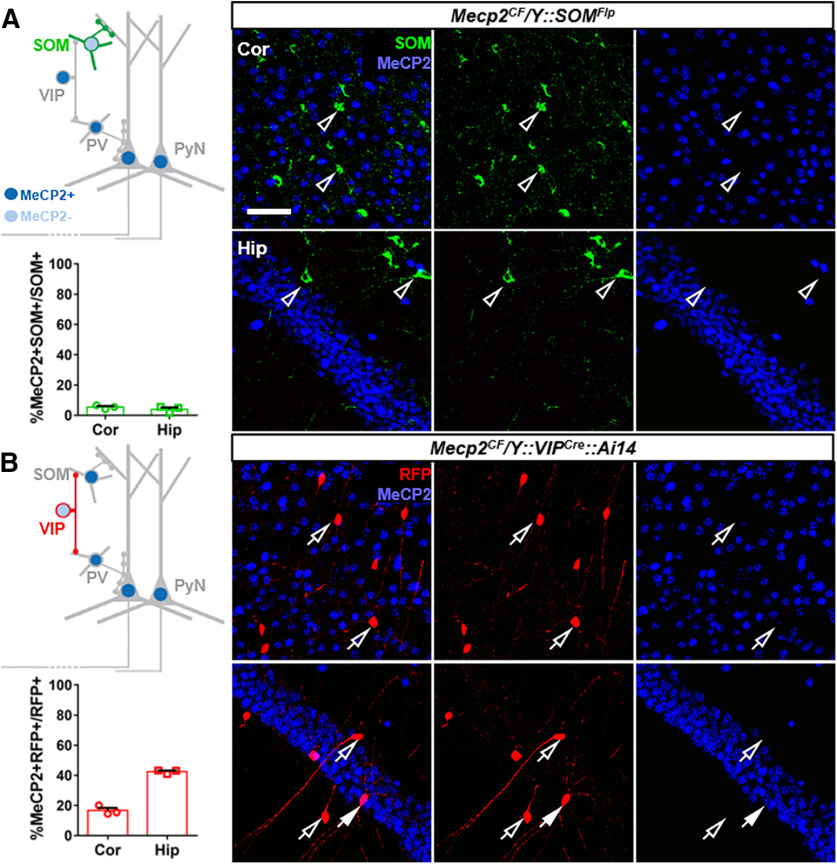
Figure 9.
Efficient Mecp2 inactivation in SOM+ and VIP+ cells. Immunostaining confirmation and quantification of efficient Mecp2 inactivation by SOMFlp (A) and VIPCre (B). Top left, Schematic view. Bottom left, Quantifications (n = 3). Data are mean ± SEM. Circles and squares represent data from individual mice. Right, Representative views in cortex (Cor) and hippocampus (Hip). Open arrowheads indicate SOM+ cells without MeCP2. Open arrows indicate RFP-expressing VIP+ cells without MeCP2. Filled arrows indicate RFP-expressing VIP+ cells with MeCP2. Scale bar, 50 μm.

