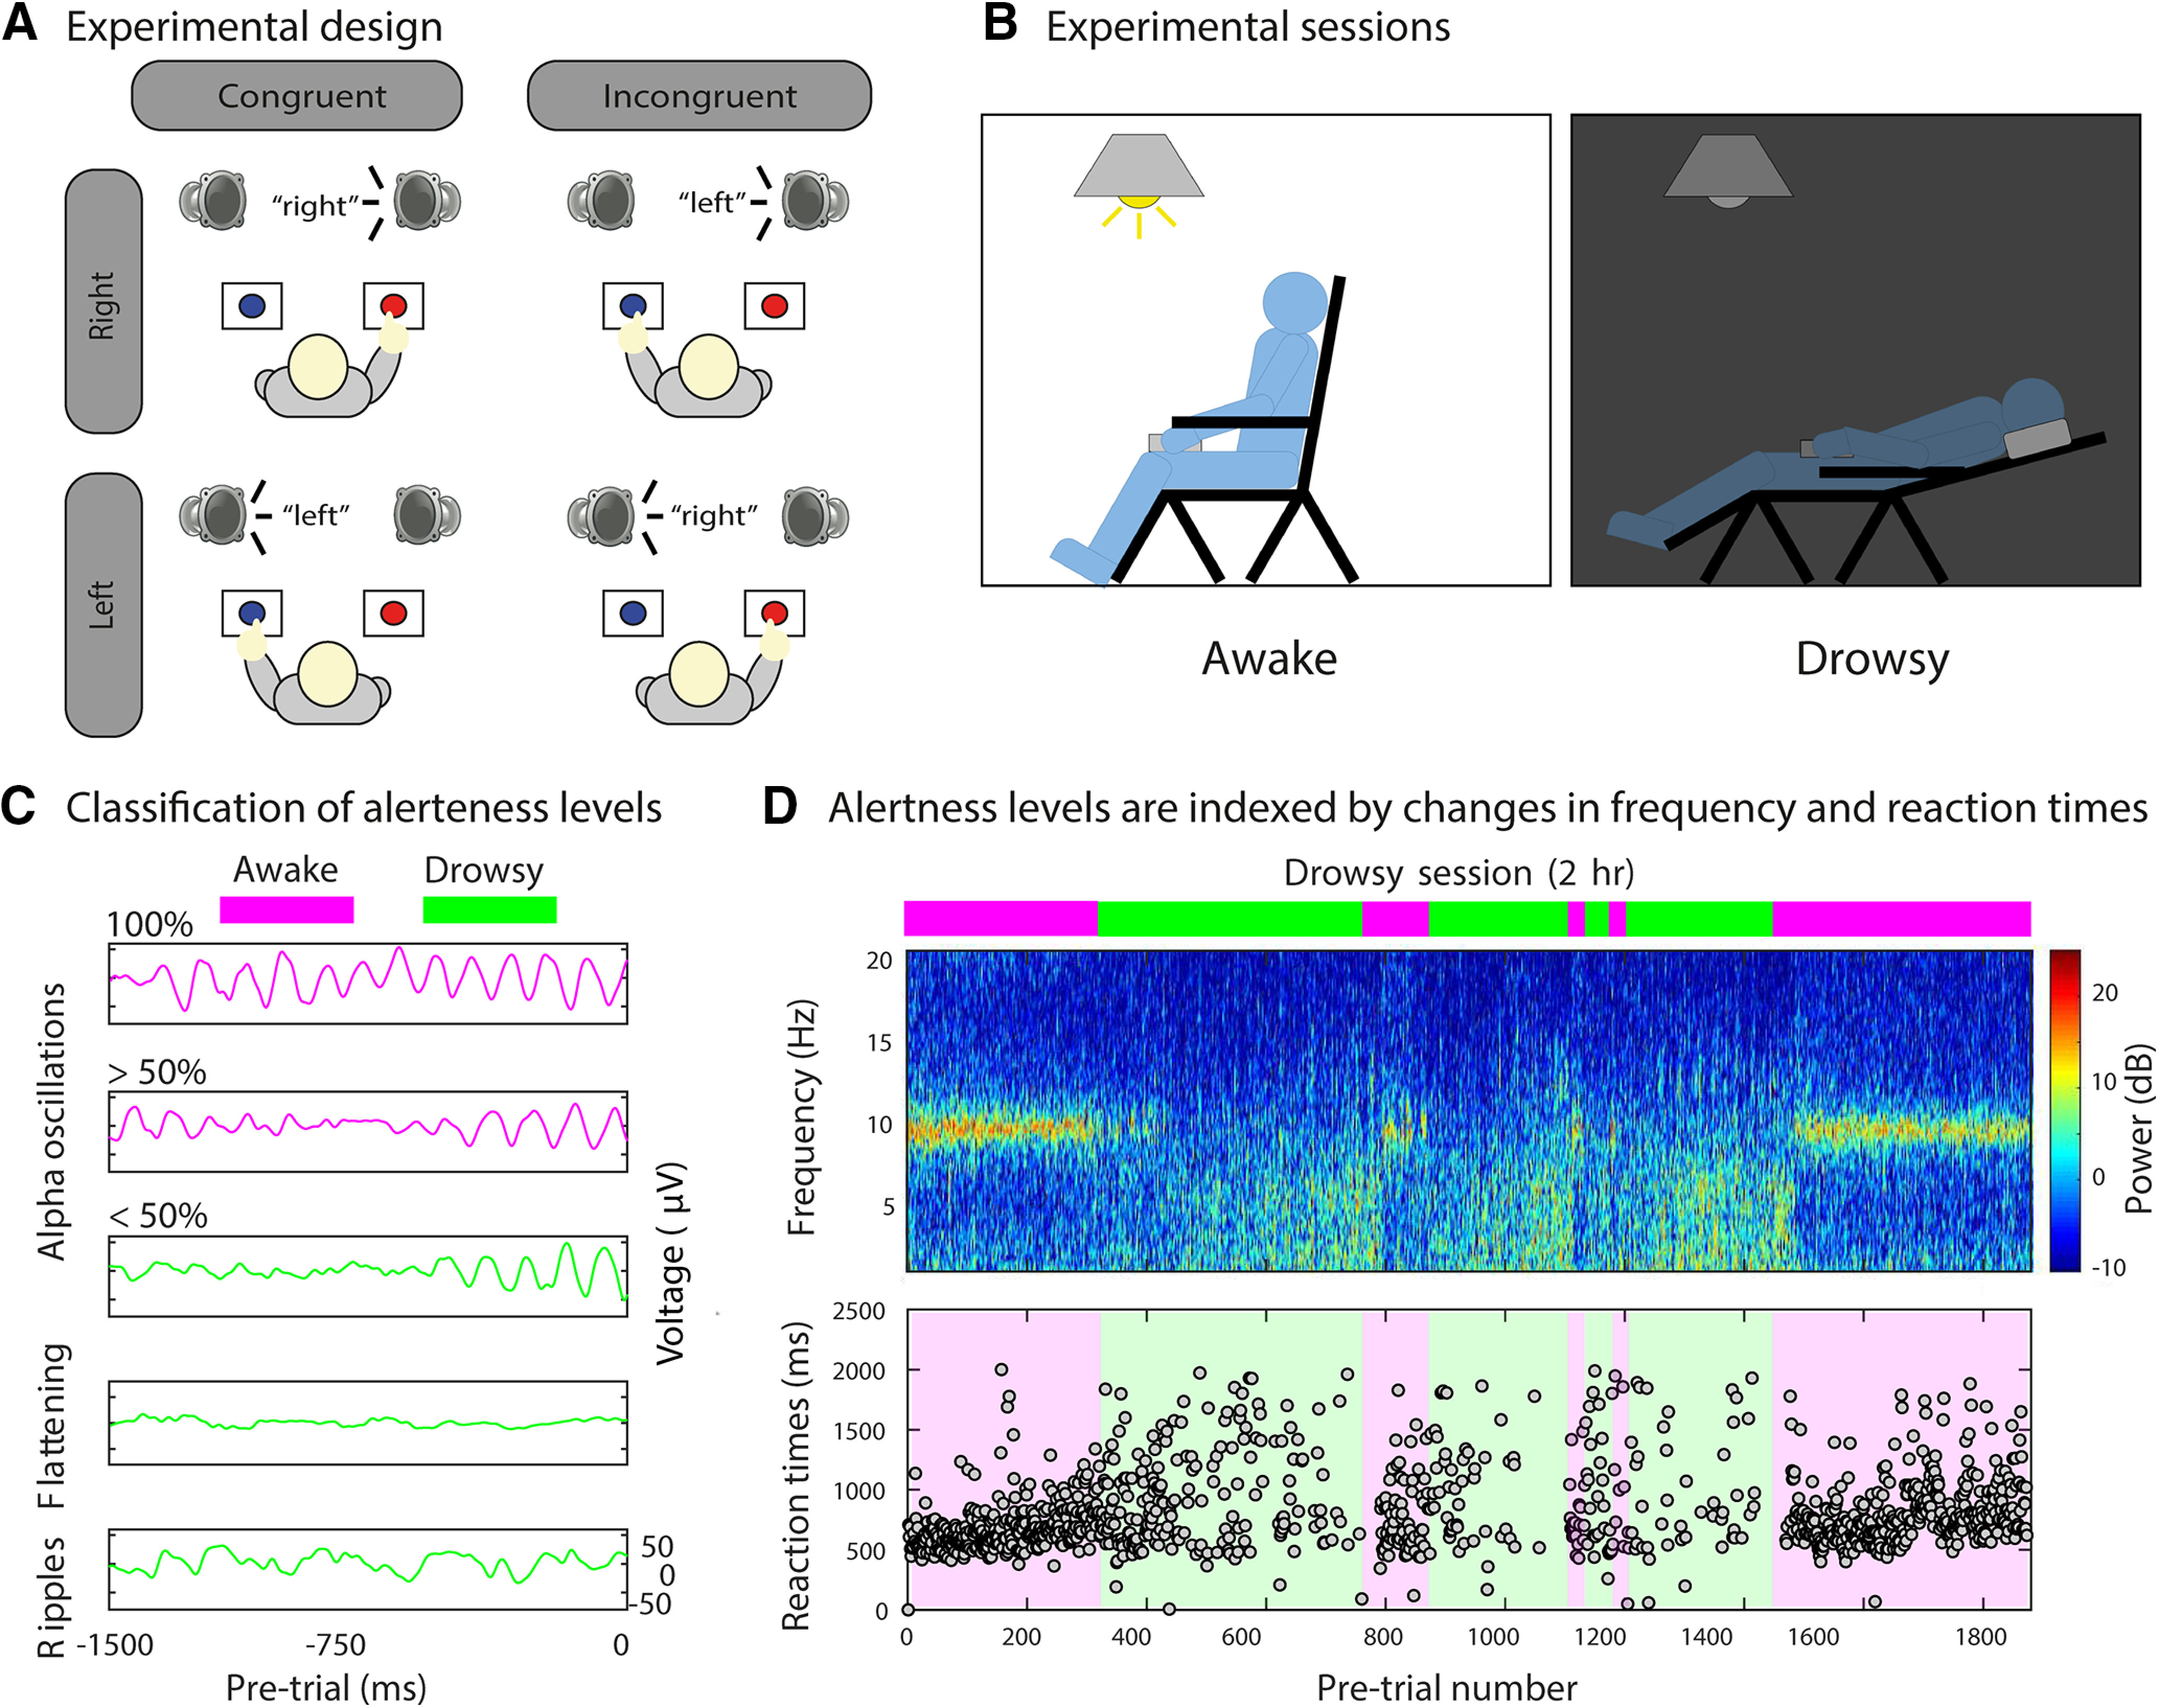
Figure 1.

Experimental paradigm and alertness level classification. A, Schematic representation of the experimental design. Participants were instructed to report the semantics (left or right) of an auditory stimulus via a button press with their left or right hand, respectively, and to ignore the spatial location at which the auditory stimulus was presented. Sound content of the auditory stimuli could be congruent or incongruent with its location of presentation (50% congruent/incongruent trials). B, Schematic representation of the experimental sessions. In the awake session, participants were instructed to stay awake with their eyes closed while performing the task with the back of the chair set up straight and the lights on. Immediately after, in the drowsy session, the task was performed while participants were allowed to fall asleep with their chair reclined to a comfortable position and the lights off. C, Automatic classification of alertness levels. For each session (awake and drowsy), pretrial periods (−1500 to 0 ms) were used for defining awake (purple) and drowsy (green) trials. Pretrials containing 100% and >50% of alpha oscillations were classified as awake. Similarly, pretrials containing <50% of alpha oscillations, EEG flattening, ripples, and other graphic elements were classified as drowsy (see Materials and Methods for details). Thus, only the trials classified as awake from the awake session and those classified as drowsy from the drowsy session were subselected for further analyses. D, Top, Automatic classification of alertness during a drowsy session (representative participant, occipital electrode). The frequency profile depicts changes in the power level in different bands during the pretrial period, and the bars on top represent pretrials classified as awake (purple) or drowsy (green). Bottom, The variability in the reaction times (bottom) closely follows the changes in the frequency profile (top) from alpha (higher RT variability in green) to theta (lower RT variability in purple) obtained using the pretrial information.
