
Figure 4.
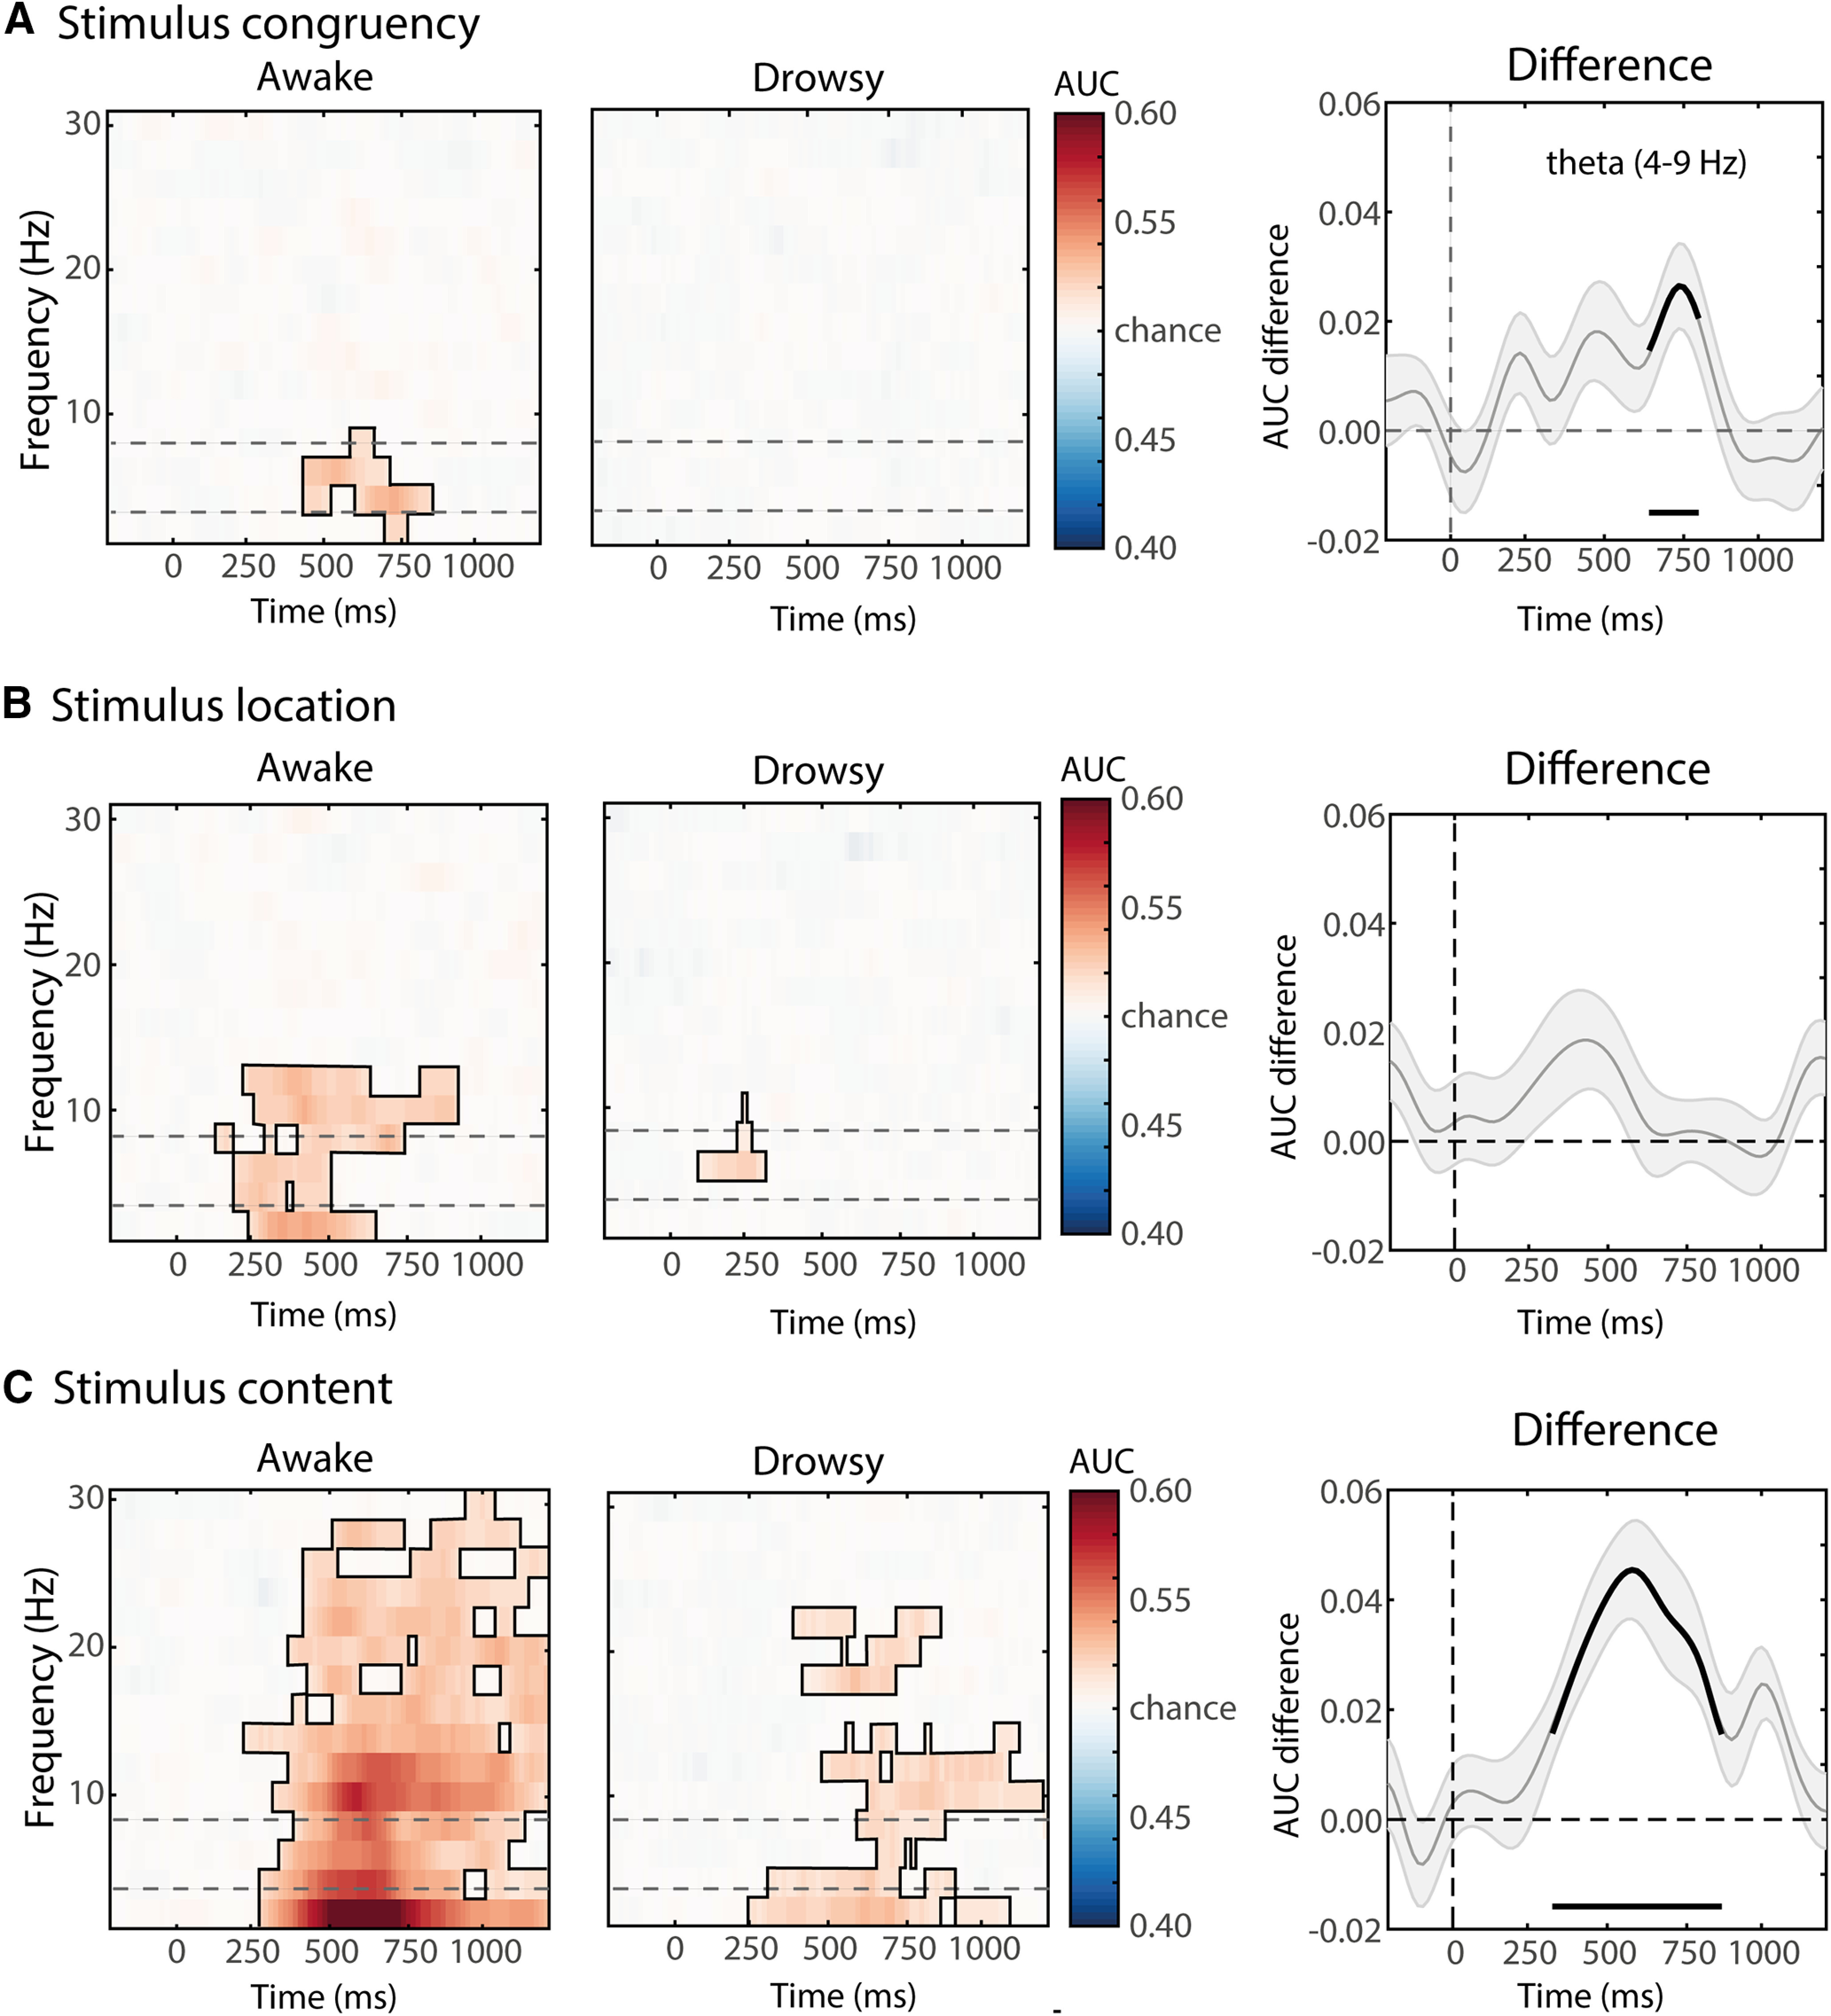
Multivariate spectral decoding of stimuli components in the awake and drowsy conditions. Classifier accuracies are depicted across time–frequency charts (2–30 Hz) for the awake and drowsy conditions separately, and for the difference between awake and drowsy conditions in the theta band. Classifier accuracy was thresholded (cluster-based correction, p < 0.05), and significant clusters are outlined with a solid black line. In the difference plots on the right, significant differences from chance are highlighted by a black solid line at the bottom of the figures. The dotted lines in the left and middle panels reflect the frequency band used for statistical testing between awake and drowsy states (right-most panels). A, Classifier accuracies for stimulus congruency (“conflict”). Information about congruency was only present in the awake condition. B, Classifier accuracies for stimulus location (“location”). Location of the auditory stimulus could be decoded in both conditions, meaning that information about this stimulus feature is present in both awake and drowsy neural frequency signals. C, Classifier accuracies for stimulus sound identities (“content”). Sound identities of the auditory stimulus could be decoded in both alertness conditions. Differences between awake and drowsy conditions were observed for stimulus congruency and identity but not for stimulus location. Grey shaded contours in AUC difference plots represent standard error of the mean (S.E.M)