. 2020 Jun 1;11(24):6222–6228. doi: 10.1039/d0sc02011g

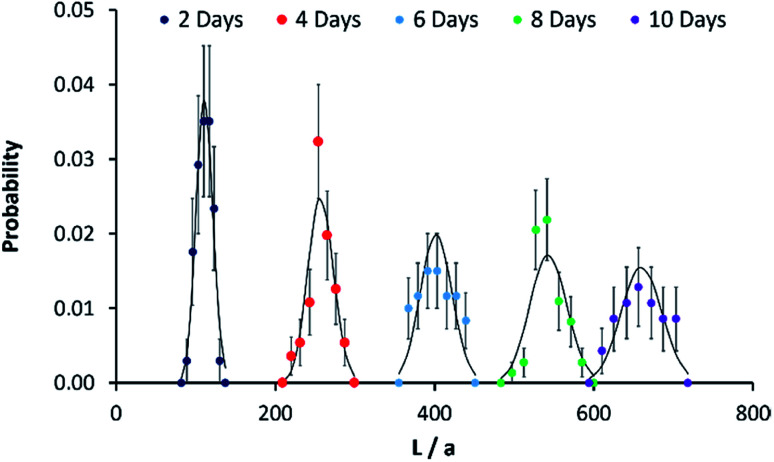
Fig. 3. Fibre-like micelle length distributions against reaction time. Probability mass functions for the length of micelles grown on gold-coated silicon slides in Fig. 2L. The solid black line shows the Poisson distribution at each time point and the x-axis is given in terms of a normalised length described in the text. The micelles were grown from 0.005 μg ml–1 seeds on gold surfaces and immersion in 0.5 μg ml–1 of unimers solution for the times stated on the legend. The probabilities were estimated using AFM to measure the length of 50 separate micelles (30 in the case of the 10 day time point); standard deviations on each data point were obtained by applying counting statistics.

Fig. 3