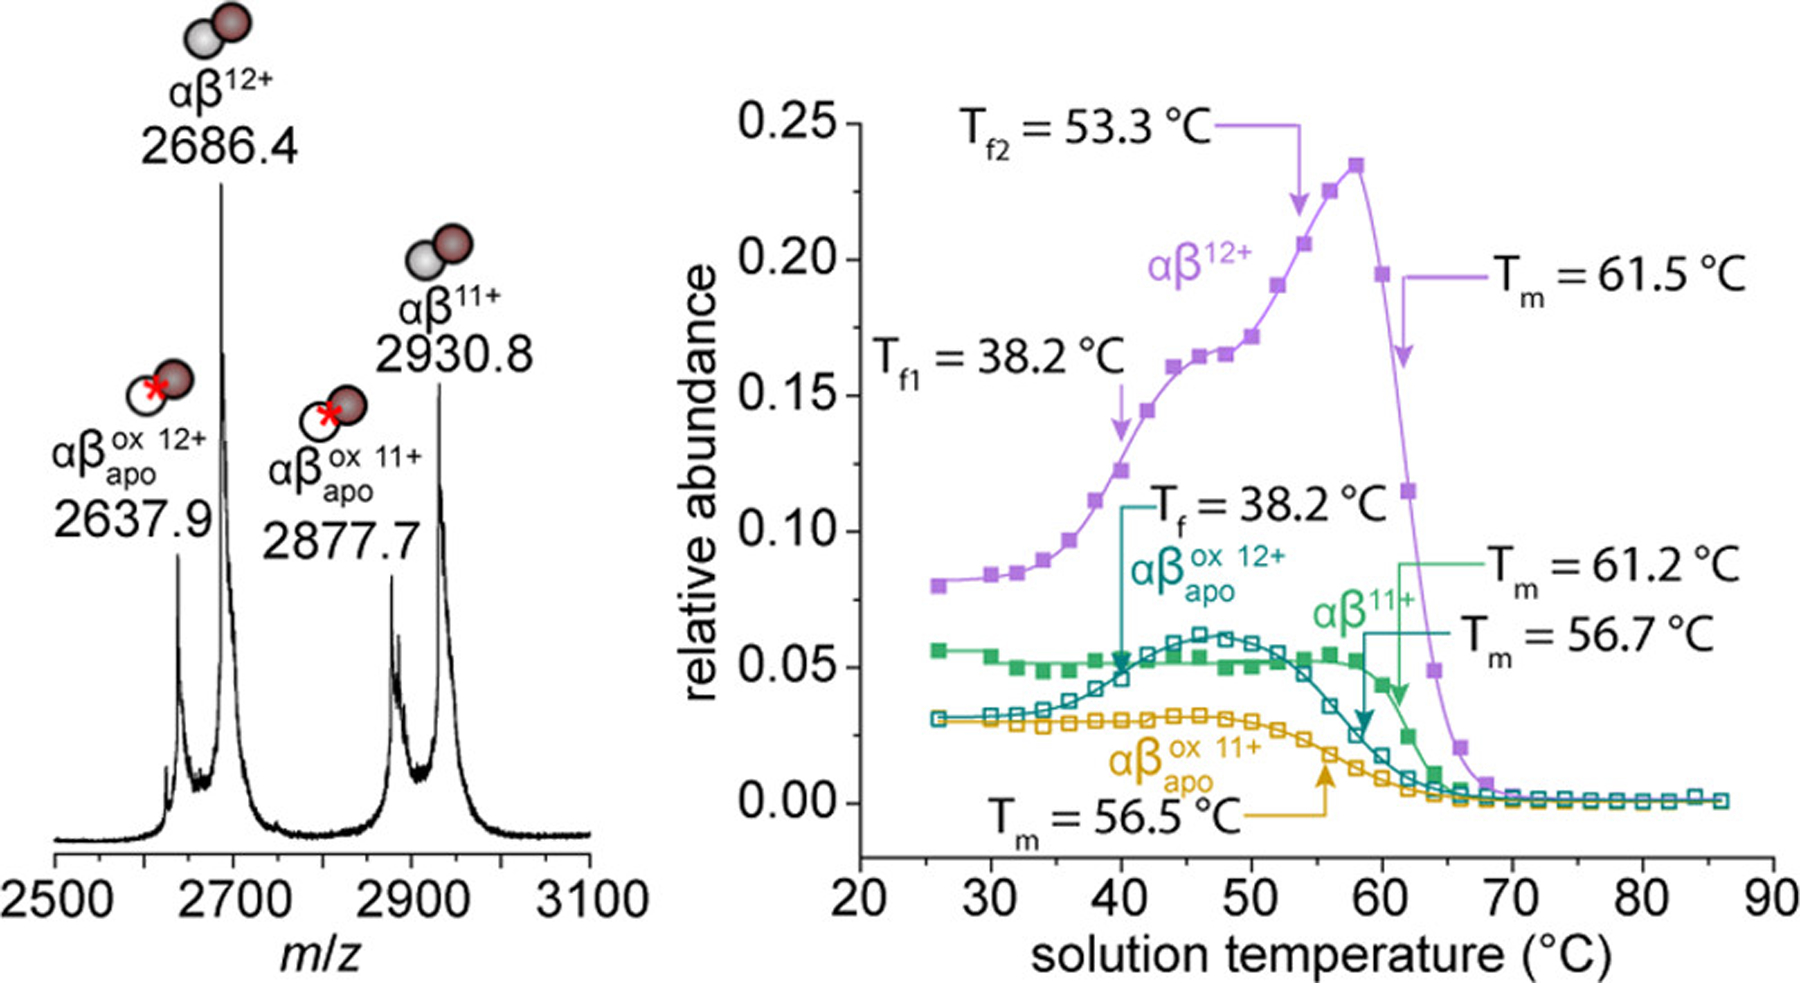
Figure 2.

Mass spectrum showing presence of αβ dimers and dimer species at 28 °C (left). Relative abundance curves of each dimer species as a function of soluition temperature (right). Mean midpoint Tm and Tf values from three replicate analyses are shown indicated by colored arrows. Relative abundance values are normalized to the total abundance of HbA signal at each temperature.
