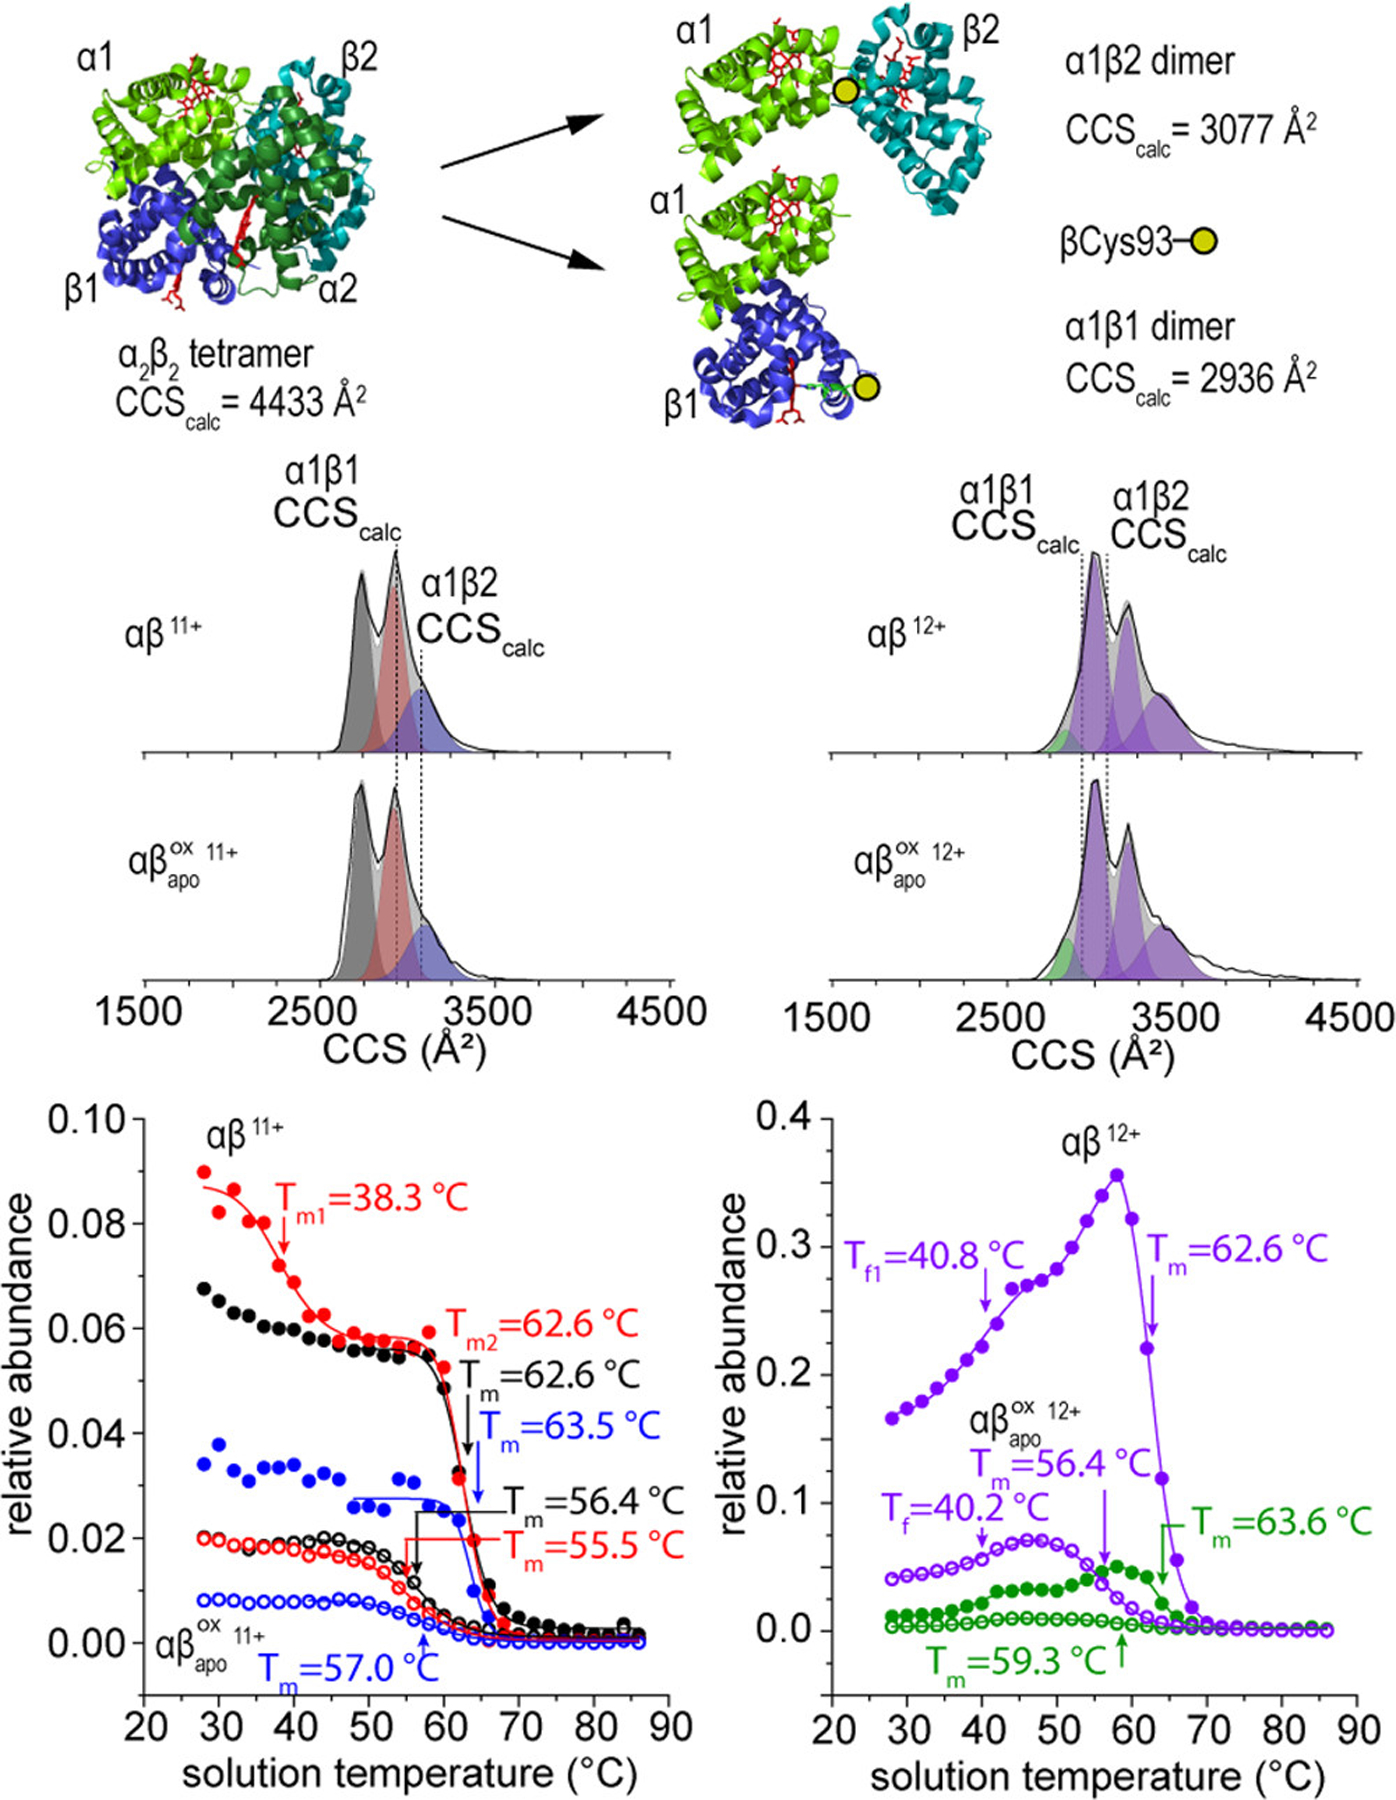
Figure 5.

General pathway for dissociation of HbA tetramer into two asymmetric αβ dimers (top).Normalized traveling wave CCS distributions of the +11 (left) and +12 (right) charge states of the αβ and dimer species at 28 °C (middle). Calculated CCSs from atomic structures are shown as a dotted line. Relative abundance curves of αβ (filled circles) and dimer species (open circles) showing the changes in conformer abundances with increasing solution temperature (bottom). The relative abundance traces correspond to the peak areas indicated by the modeled Gaussian peaks of the same color in the CCS distributions. Relative abundance values are normalized to the sum of all drift time signals at each temperature.
