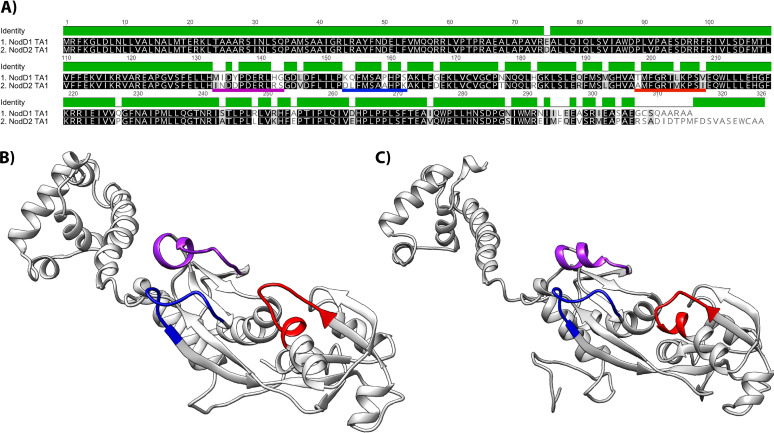
FIG 5.
Alignment of TA1 NodD1 and NodD2 amino acid sequences and corresponding predicted protein structures shown as ribbon models constructed using Phyre2. (A) Amino acid sequence alignment. The background tone indicates amino acid similarity, where black is identical, dark gray is similar, light gray is not similar. The green bar indicates conserved residues. Three regions corresponding to the predicted flavonoid inducer binding pocket entrance are underlined in purple, blue, and red. (B) TA1 NodD1. (C) TA1 NodD2. The location of the residues highlighted in (A) are shown on the ribbon structures with corresponding colors.

