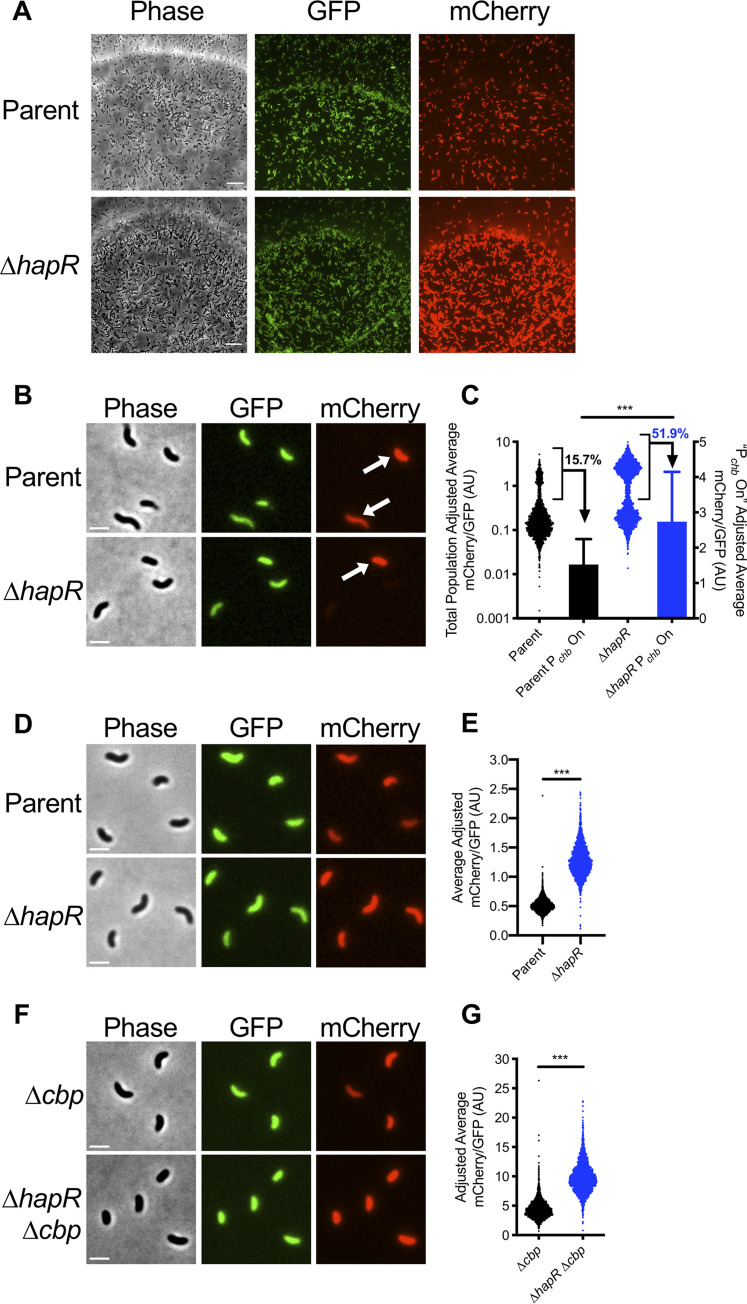
FIG 2.
HapR-mediated repression of Pchb occurs on chitinous surfaces. (A) Representative images of the indicated V. cholerae strains grown on chitin beads. The parent strain background contains both a Pchb-mCherry reporter and a Pconst2-GFP construct, which exhibits constitutive GFP expression. Scale bar = 10 μm. (B and C) Pchb expression in the indicated V. cholerae cbp+ strains grown on chitin beads. (B) Representative images of cells that were vortexed off chitin beads. Arrows demarcate cells where Pchb expression is induced (“Pchb on” cells). Scale bar = 2 μm. (C) Scatterplot and bar graph showing the relative expression of the Pchb-mCherry reporter in cells cultured on chitin beads. Scatterplots (left y axis) represent the entire population, whereas the bars (right y axis) represent only the Pchb on cells (bracketed in black on scatterplots). The percentage of cells in the Pchb on population is indicated. n = 2,120 for parent; n = 2,191 for ΔhapR strain; n = 333 for parent Pchb on; n = 1,139 for ΔhapR strain Pchb on. Data shown are from two independent biological replicates. (D and E) Pchb expression of the indicated V. cholerae strains where Pchb expression is induced by chitin oligosaccharides. (D) Representative images of cells grown with chitin oligosaccharides. Scale bar = 2 μm. (E) Scatterplot showing the relative expression of a Pchb-mCherry reporter in the indicated V. cholerae strains. n = 2,735 for parent; n = 2,384 for ΔhapR strain. Data shown are from two independent biological replicates. (F and G) Pchb expression of the indicated V. cholerae strains where Pchb expression is induced via deletion of cbp. (F) Representative images of cells grown in the absence of chitin. Scale bar = 2 μm. (G) Scatterplot showing the relative expression of a Pchb-mCherry reporter in the indicated V. cholerae strains. n = 2,407 for Δcbp strain; n = 2,313 for ΔhapR Δcbp strain. Data shown are from two independent biological replicates. Statistical comparisons in panels C, E, and G were made using Student's t test. ***, P < 0.001.

