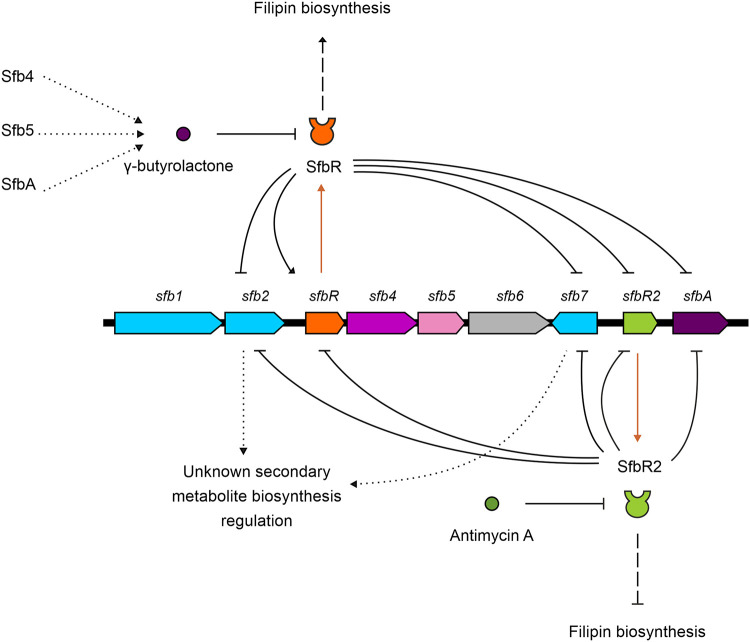
FIG 10.
GBL regulatory model in S. filipinensis. The solid-line arrow/bar represents direct activation/repression. The dashed-line arrow/bar represents indirect activation/repression. Dotted lines represent hypothetical data. Lines in brown represent transcription and translation of sfbR or sfbR2. Gene coloring is used as described in the Fig. 1 legend.

